In 2014, Vunidogoloa became the first climate-relocated village in Fiji. They relocated to higher ground after rising sea levels made their original coastal location uninhabitable. The move improved housing and access to schools and nearby services. Credit: GIZ Pacific.
When Home Moves
From climate disaster and displacement to resilience: a journey across the Pacific.
Stay or leave? Many of us hope we never have to answer this question.
When floods rise or seas breach the shore, families have moments to decide what to save and what to leave behind. Some return to ruins; others find their homes erased.
Across the Pacific, this is the new reality.
Climate disasters are redrawing the map of the region, forcing communities inland, through repeat disasters, toward the agonizing choice: cling to ancestral soil or leave it behind.
When home vanishes, where do you go?
Chapter 1
A crisis measured in millions
The Pacific contributes almost nothing to the climate crisis, yet bears its harshest brunt.
Low-lying nations, like Tuvalu, emit less than 0.0002% of global greenhouse gases — fractions compared to New Zealand's emissions, which were nearly 3,500 times higher than Tuvalu’s in 2023.
How do Pacific Island emissions compare with major emitters?
Greenhouse gas emissions in 2023, in million tonnes of CO₂ equivalent. Square area represents emissions; the Pacific detail is enlarged.
- China 13,152.05 MtCO₂e
- United States 5,434.18 MtCO₂e
- Australia 651.66 MtCO₂e
- New Zealand 69.96 MtCO₂e
- Pacific islands 0.63 MtCO₂e
Pacific detail
Enlarged view of Fiji, Kiribati and Tuvalu.
- Fiji 0.52 MtCO₂e
- Kiribati 0.09 MtCO₂e
- Tuvalu 0.02 MtCO₂e
| Country | Million tonnes CO₂ equivalent |
|---|---|
| China | 13,152.05 |
| United States | 5,434.18 |
| Australia | 651.66 |
| New Zealand | 69.96 |
| Fiji | 0.52 |
| Kiribati | 0.09 |
| Tuvalu | 0.02 |
As rising seas, extreme flooding, and rapid coastal erosion ravage the region, the human toll is staggering. Between 2008 and 2025, climate and geophysical disasters affected over 2.5 million people across the Pacific, based on an analysis from the Pacific Data Hub.
Fiji has endured the region’s highest cumulative impact, with more than 1.2 million people affected. In 2016, the historic Category 5 Cyclone Winston — alongside two other storms — impacted roughly 60% of the nation's population.
A note about how different organizations define a disaster
There is a debate over how to define a “climate disaster.” The Internal Displacement Monitoring Centre (IDMC) does not automatically count people displaced by weather disasters as “climate-displaced,” as they view the link to climate change as scientifically complex. In contrast, the Othering & Belonging Institute (OBI) argues that these disasters are deeply tied to climate change and its role in worsening displacement. To better highlight this connection, this essay adopts the OBI’s approach of classifying weather-related disasters as climate-driven events.
The threat is escalating. Extreme weather puts at least 50,000 Pacific Islanders at risk of losing their homes annually, with the vast majority remaining within national borders as internally displaced persons (IDPs).
Between 2008 and 2025, the Internal Displacement Monitoring Centre (IDMC) recorded 247 events that triggered nearly one million internal displacements across the Pacific. Internal displacement refers to the forced movement of people within the country they live in.
Internal displacement movements by country in the Pacific
Annual disaster-related internal displacement movements varied sharply across 17 Pacific countries and territories from 2008 to 2025. Select any year to see the reported events and hazards.
American Samoa
Cook Islands
Fiji
French Polynesia
Guam
Kiribati
Marshall Islands
Micronesia (Federated States of)
New Caledonia
Northern Mariana Islands
Palau
Papua New Guinea
Samoa
Solomon Islands
Tonga
Tuvalu
Vanuatu
Years without a reported disaster displacement event are shown as zero. Values count displacement movements rather than unique individuals. A single person can be forced to flee their home multiple times.
Chapter 2
What Forces People to Leave?
Weather disasters, not geophysical ones like earthquakes or volcanic eruptions, are what uproot communities in the Pacific.
The chart below traces those climate shocks from hazard to displacement. Each ribbon represents the path of displacement movements following a disaster. Wider ribbons indicate larger numbers of displacements.
The disasters driving displacement movements
Follow 907,531 recorded internal displacement movements through hazard families, types, and subtypes. Scroll to explore.
Scroll to explore the pathways
Between 2018 and 2025, storms caused significantly more flight than floods or earthquakes.
Within this category, typhoons, hurricanes, and cyclones form the leading hazard subtype for displacements. Tropical cyclones dominate the flow through nearly every country in the region.
A few catastrophic cyclones account for a disproportionate share of this total, most notably Cyclone Winston in Fiji in 2016.
Floods, the second-leading driver, caused 227,226 movements across 71 events. They leave a lingering aftermath of contaminated freshwater supplies, destroyed crops, and waterlogged soils.
The disaster affected-population total and displacement total measure different things: displacement data count movements, not unique people.
Source: Pacific Data Hub; Internal Displacement Monitoring Centre (IDMC).
In 2016, Winston tore across the South Pacific. It was the first Category 5 tropical cyclone ever recorded in the Southern Hemisphere, and the second strongest to make landfall anywhere on Earth. The storm upended life for 62% of Fiji’s population, triggered 62,000 internal displacement movements, and cost the nation one-third of its annual gross domestic product (GDP).
A history of disaster displacement events and hazard types
Explore every recorded disaster that triggered internal displacement across Pacific countries from 2008–2025. Hover or tap a dot for event details.
Each dot represents one recorded disaster event. Country totals update with the selected hazard types.
Source: Pacific Data Hub; Internal Displacement Monitoring Centre (IDMC).
In rural and maritime areas, traditional homes built primarily from wood and corrugated iron stood no chance against Winston’s 280 km/h winds. Making matters worse, the vast majority of rural residents lacked any form of property or crop insurance, leaving them dependent on external aid.
Four years later, Tropical Cyclone Harold slammed into Fiji, Vanuatu, and Tonga, forcing another 10,000 displacement movements. The storm complicated recovery efforts during the strict lockdowns and severe economic strains of the COVID-19 pandemic.
Extensive damage on Tongatapu and 'Eua coastlines caused by Severe Tropical Cyclone Harold in 2020
Before and after satellite images. Drag the handle, or focus it and use the arrow keys, to compare the images.
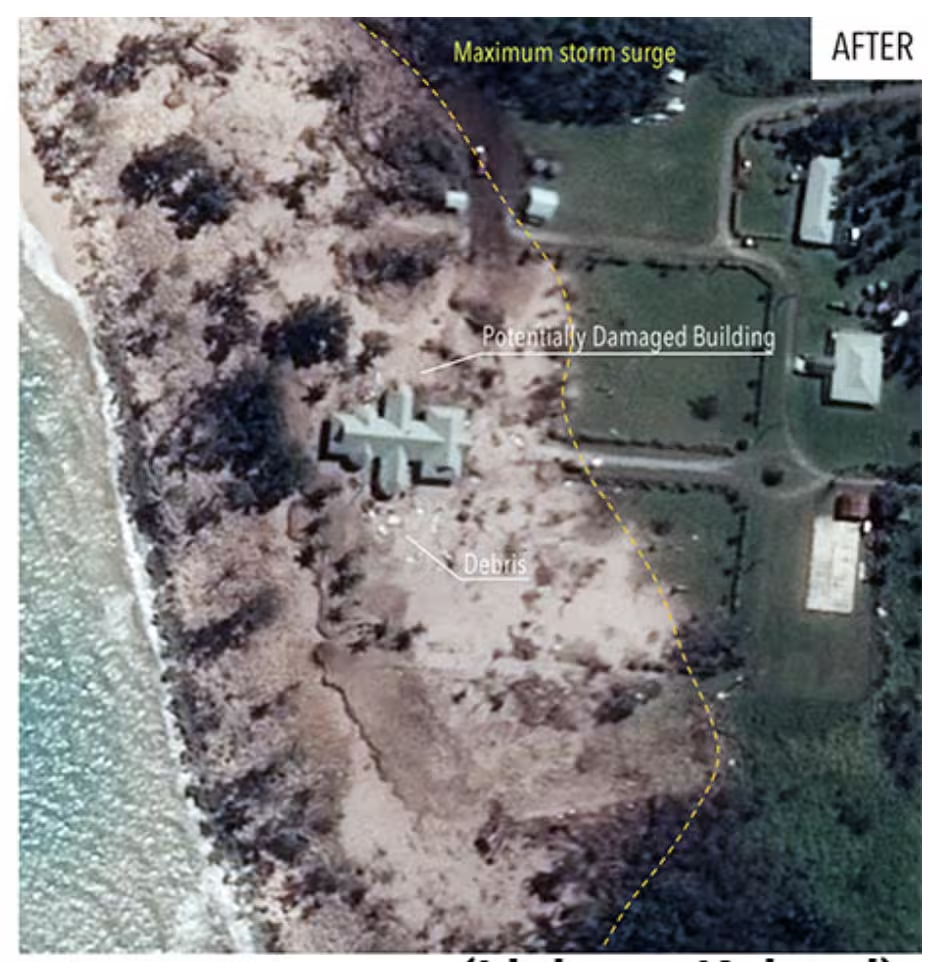
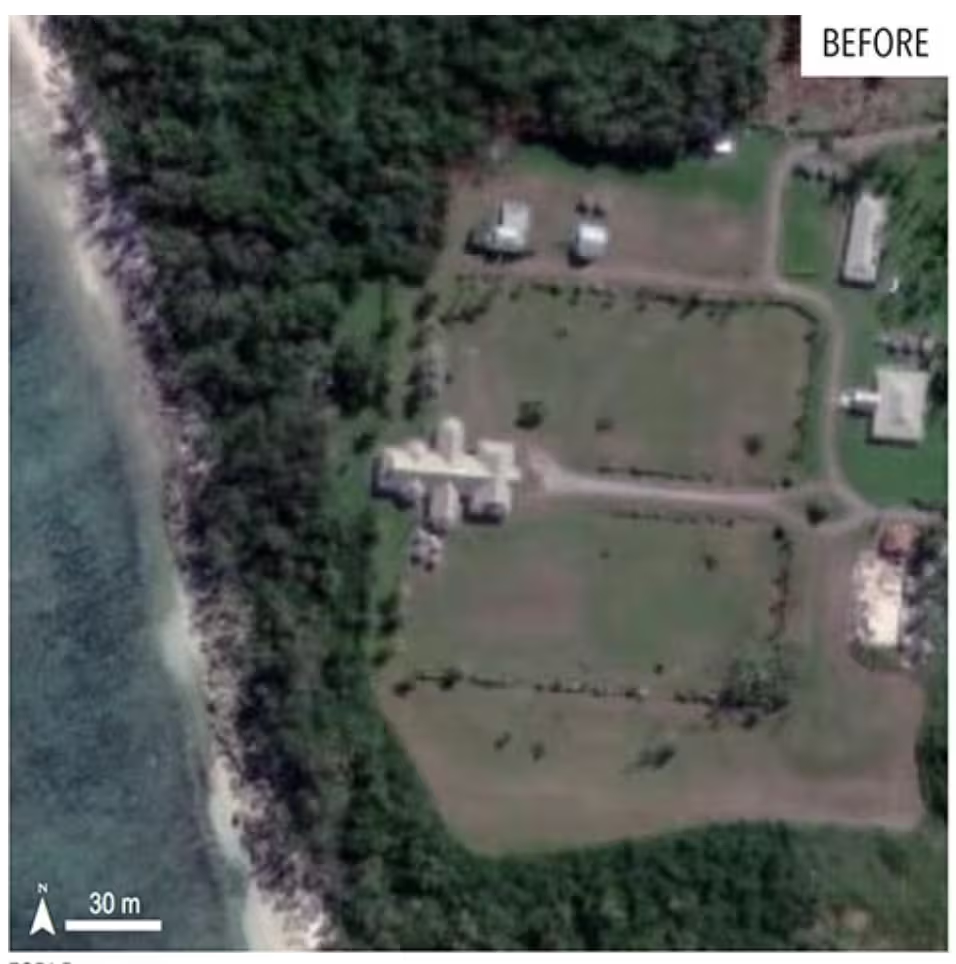
Source: Matangi Tonga; UNITAR / UNOSAT.
Chapter 3
When Disasters Don’t End
Displacement is not always due to a single climate disaster with a clear beginning and end. It can be from recurring disasters that reset national development.
Between 2016 and 2021, Pacific nations endured 13 extreme weather events, including three that broke regional records. Globally, the average window between disasters has shrunk from 82 days in the 1980s to 19 days in the 2020s. This leaves communities with little to no time to rebuild before the next strike.
Papua New Guinea leads the region with 81 separate displacement events over 15 years. It ranks 16th globally for disaster risk on the INFORM Risk Index, vulnerable to floods, droughts, and cyclones.
Lacking a systemic cushion, it ranks 10th globally for severe lack of coping capacity. When disasters hit, neither residents nor the national government has the fiscal reserves to rebuild.
Chapter 4
What Happens After Disasters Hit?
Coupled with fragile infrastructure, climate disasters can exacerbate compromised freshwater and contaminated ecosystems. These factors make recovery far more complex than rebuilding homes alone.
Legacy of environmental hazards
Climate disasters not only displace people, but also expose buried toxic legacies.
Between 1946 and 1958, the U.S. military detonated 67 nuclear weapons in the Marshall Islands. This included the 15-megaton "Castle Bravo" blast — an explosion 1,000 times more powerful than the bombs dropped on Hiroshima and Nagasaki combined. The explosion blanketed 11,000 square kilometers in radioactive fallout, rendering islands uninhabitable and displacing indigenous populations.
Years later, the U.S. military bulldozed 90,000 cubic meters of contaminated soil into the Runit Dome crater, capping it with an 18-inch-thick concrete dome. To save time and money, the bottom of the crater was never lined with concrete.
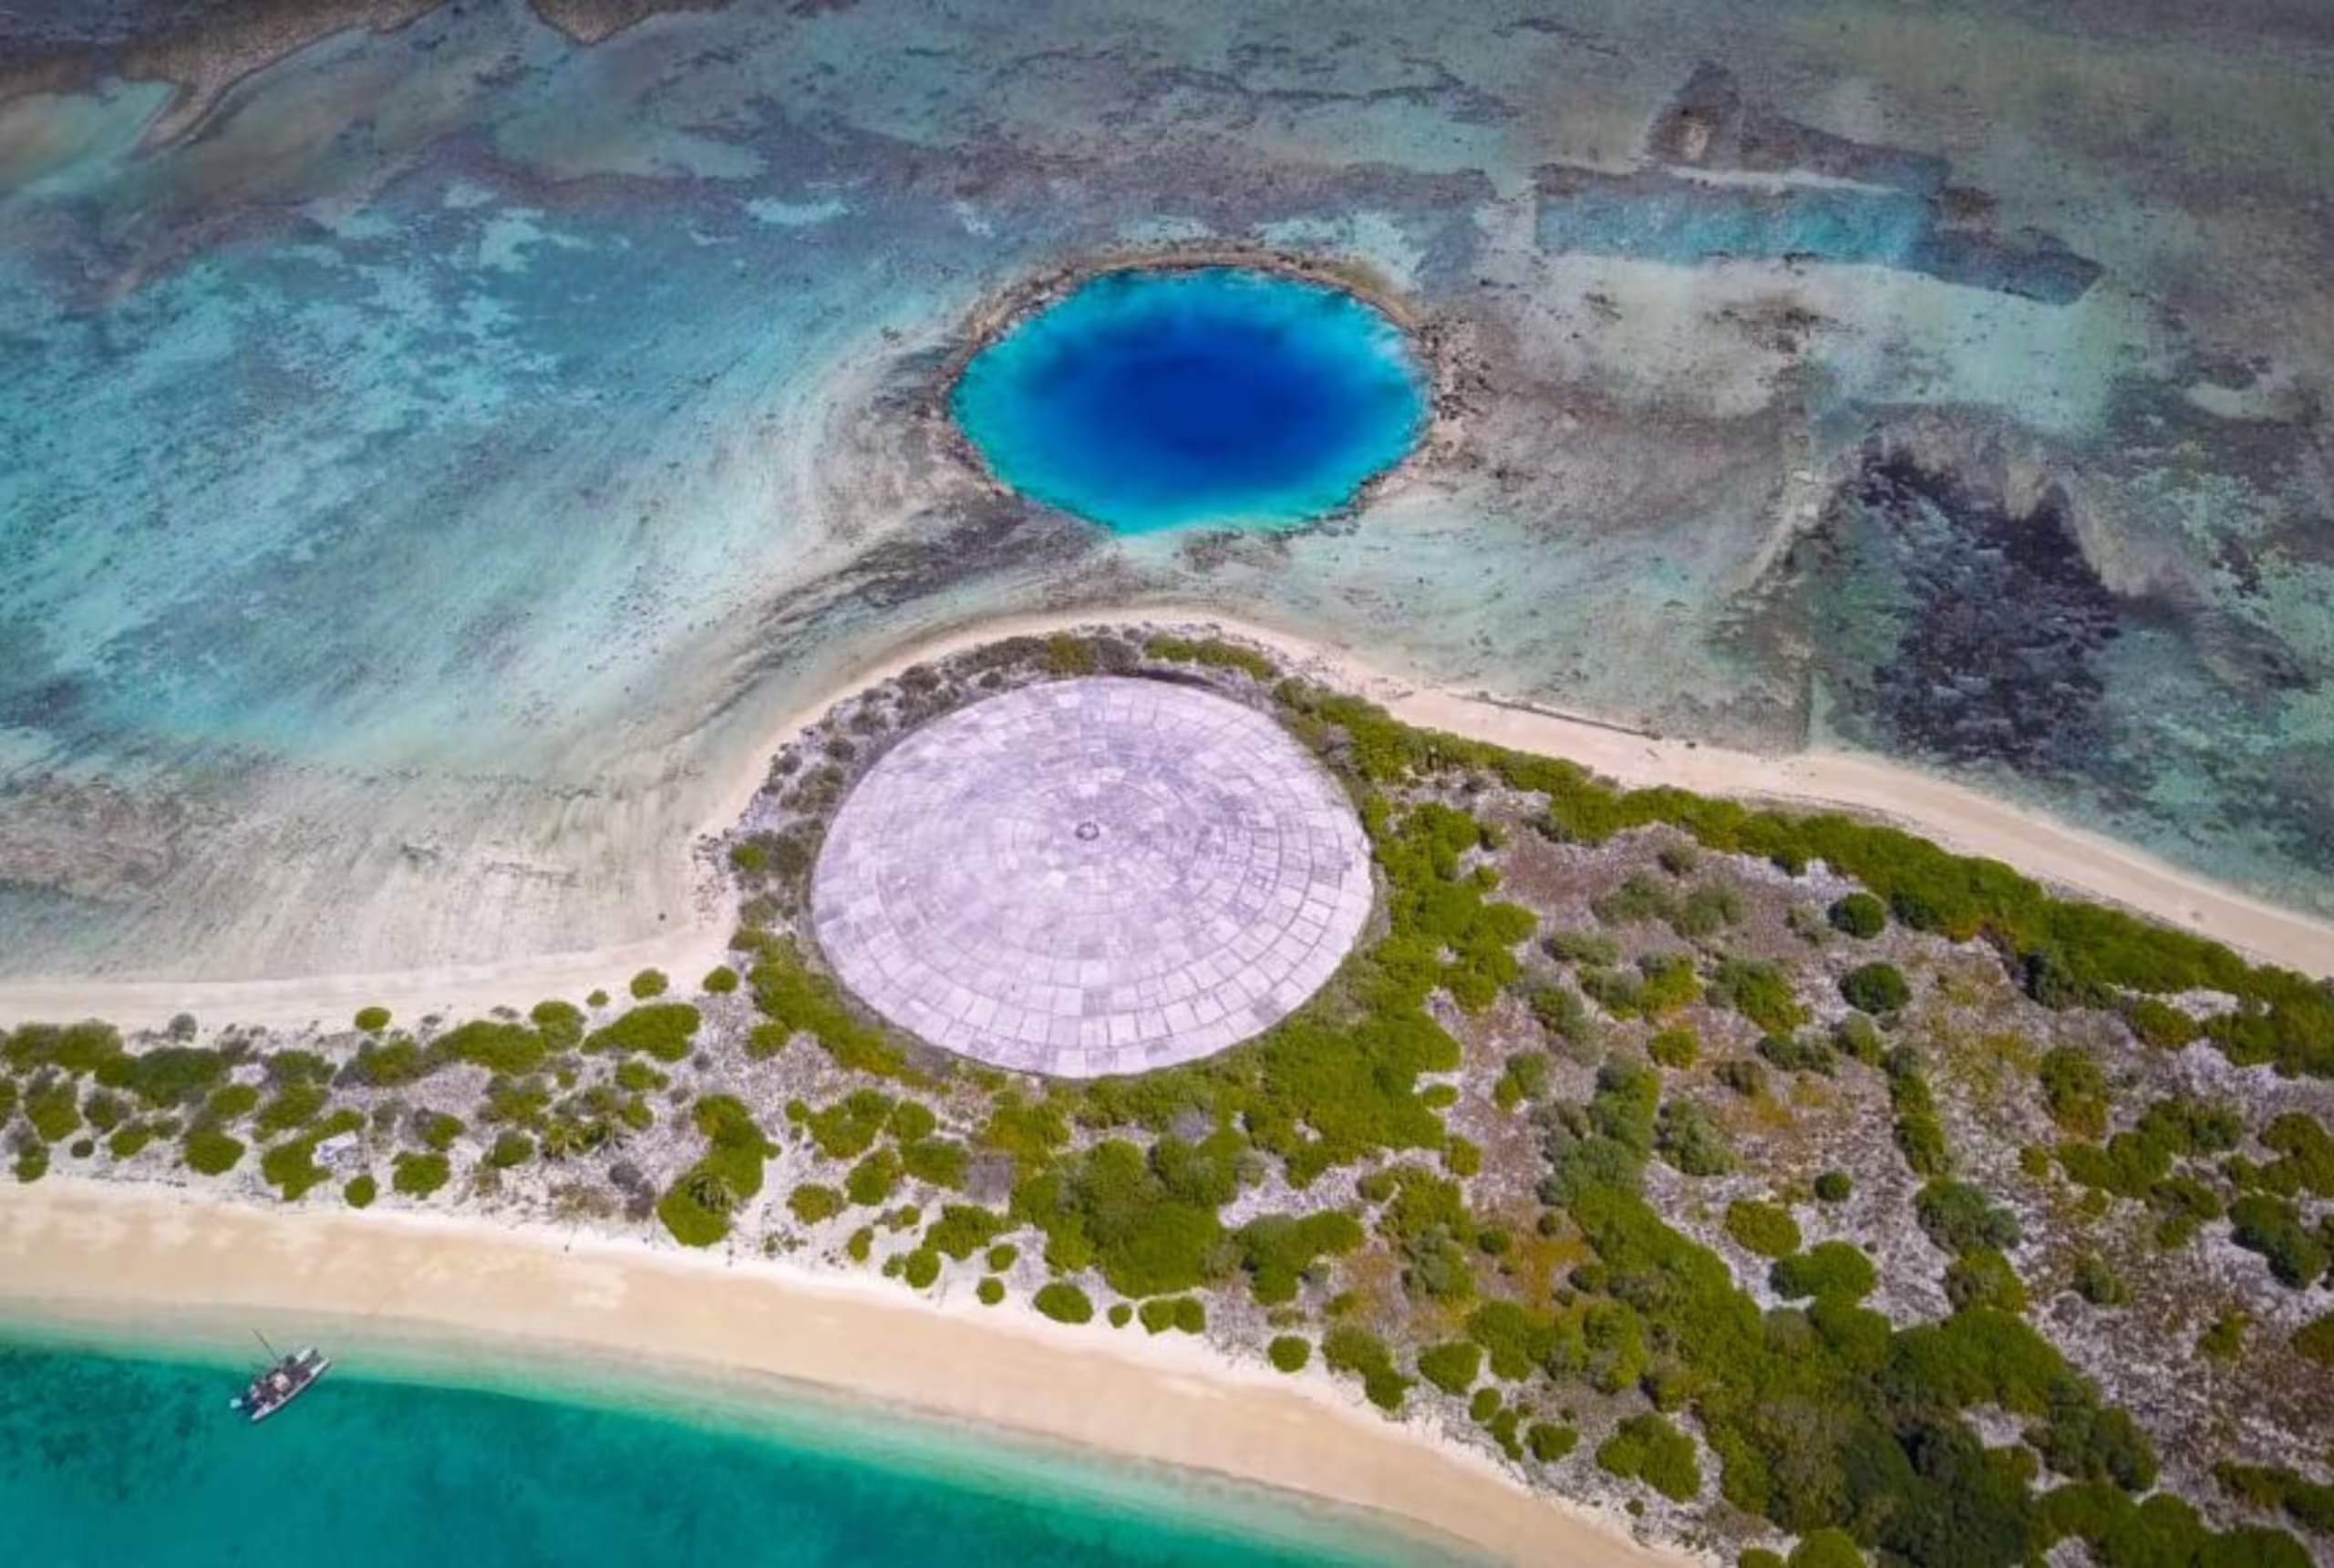
Today, rising seas and high tides flush radioactive plutonium through the unlined crater directly into the North Equatorial Current, where it has been detected over 2,800 miles away.
As intensifying storms threaten to breach the concrete cap, Runit Dome remains a ticking nuclear-climate time bomb and an environmental injustice threatening a new wave of displacement.
Economic loss
Climate disasters cripple regional economies. For example, Fiji recorded approximately $374 million USD in direct losses in 2016 from Cyclones Winston, Xena, and a tropical depression.
In 2020, Tropical Cyclone Harold struck after border closures had already devastated the tourism sector — the lifeblood of the Fijian economy — causing a 20% contraction in Fiji's GDP. This is the reality of “cascading vulnerabilities”: a subsequent disaster hits a population with already depleted defenses.
Economic impact of climate disasters in the Pacific
Each data point is a Pacific country-year with both measures reported. Hover or click a point for details. Diamonds mark years when zero people were reported directly affected.
Note: A reported zero means disasters can damage land and infrastructure without directly affecting people. Country-years without an affected-population value are not plotted.
Source: Pacific Data Hub, Number of directly affected persons attributed to disasters and Direct disaster economic loss.
To rebuild critical infrastructure, like roads and hospitals, after such shocks, low-lying island nations must borrow massive sums relative to their small economies, trapping them in a debt loop.
As global aid diminishes by 16% due to major funding cuts from the U.S. and U.K., Pacific nations are forced to spend up to 30% of their national budgets on climate adaptation, such as constructing seawalls, building embankments, and desalinating water.
Tuberculosis incidence
Displacement triggers and worsens existing public health crisises.
In the Pacific, 90% of people live within five kilometers of a coastline and over a quarter within one kilometer. In South Tarawa, Kiribati, over 60,000 residents are crammed into a 15-square-kilometer strip of land. Households average more than seven people, and it is common for 15 to 40 people to share tiny, two-room traditional dwellings.
Fleeing sinking outer islands for centralized urban refuges creates extreme crowding and makes airborne diseases like Tuberculosis (TB) rampant.
In 2023, the Marshall Islands recorded the region's highest TB rate of 692 per 100,000 people — a 723% surge since 2000. Kiribati and Tuvalu follow, both exceeding the regional median of 48 per 100,000 people, based on Pacific Data Hub findings.
Tuberculosis incidence rates in Pacific Island Nations
Annual estimated new and relapse TB cases per 100,000 people, 2000–2023. Search to compare places. Hover or click a point for its annual rate.
Source: Pacific Data Hub, Tuberculosis incidence per 100,000 population. Global benchmark: World Bank, Incidence of tuberculosis (per 100,000 people), sourced from the World Health Organization’s Global Tuberculosis Report.
Unsafe drinking water
Floods and droughts leave communities without safe water by contaminating or depleting supplies. Low-lying coral atolls have no rivers. So, they rely on fragile rainwater harvesting and underground freshwater lenses that rising seas and King tides poison via saltwater intrusion.
Papua New Guinea has the region's lowest water security, with nearly half the population lacking safe access as of 2022. In the Solomon Islands, access plummeted by approximately 12 percentage points, from 79% in 2000 to 67% in 2021. In Kiribati, unsafe water fuels disease, contributing to the highest infant mortality rate in the Pacific.
Long-term access to safely managed drinking water in the Pacific
The first and latest reported prevalence rates for each Pacific country or territory. Years vary according to data availability. Filter by direction, then hover, focus, or select a country to emphasize its change.
Values show the proportion of the population using safely managed drinking water services. Endpoint years differ where reporting periods vary.
Source: Pacific Data Hub, Proportion of population using safely managed drinking water services.
Undernourishment
Climate disasters and saltwater intrusion destroy traditional crops and ruin agricultural soil. Communities, thus, are forced to rely on low-nutrient, imported processed canned foods, like canned spam.
As of 2023, the Food and Agriculture Organization of the United Nations (FAO) estimated 29% of Papua New Guinea’s population is undernourished. During the 2015–2016 El Niño drought, famine affected 1.3 million people, leaving nearly half a million in critical food shortage. In the Solomon Islands, undernourishment rates nearly doubled to 20% in 2023.
Long-term prevalence of undernourishment in the Pacific
Undernourishment prevalence rates for Pacific countries with available long-term data between 2001 and 2023. Rising prevalence indicates worsening undernourishment.
Filter by direction, then hover, focus, or select a country to emphasize its change.
Values show the estimated prevalence of undernourishment as a percentage of the population.
Source: Pacific Data Hub and FAO, Prevalence of undernourishment.
This dietary shift sparked a metabolic crisis. As of 2023, 82% of adults in the region are overweight or obese, 33% have hypertension, and 40% have high cholesterol. Because diabetes and obesity compromise the immune systems, they increase a person's susceptibility to active TB.
Chapter 5
Fighting Back
For many, leaving home is a last resort, yet, communities navigate a legal vacuum. The 1951 Refugee Convention does not recognize climate displacement as grounds for refugee status, and strict immigration barriers like New Zealand’s Acceptable Standard of Health (ASH) rules reject applicants who place high demands on health services, including mandatory waiver denials for certain tuberculosis conditions.
To preempt displacement, Pacific governments, Indigenous leaders, and communities are proactively developing measures like restoring mangrove forests and coral reefs and upgrading early warning systems. The Framework for Resilient Development in the Pacific highlights that climate resilience and adaptation must be community-led to protect culture, livelihoods, and vital connections to place.
List of good practices to reduce the risk, scale, and impacts of internal displacement in the Pacific Islands
Select a card to turn it over. Select outside the open card or press Escape to return to the grid.
Fiji is a global leader in planned climate relocation. Its 130-page blueprint, the Standard Operating Procedures (SOP) for Planned Relocations mandates exhausting all engineering solutions, such as river dredging and raising homes, before moving. These rules emerged from early mixed results in early relocations. In 2014, Vunidogoloa became Fiji's first climate-relocated village, moving 140 residents two kilometers inland. While safe, they lost proximity to ancestral burial grounds and fishing reefs, and newly constructed homes lacked kitchens because planners consulted only male leaders.
A 2012 landslide buried half of Tukuraki, killing four people. Before relocating in 2017, survivors endured years in tents and caves while Cyclones Evan and Winston tore through their temporary infrastructure. Post-move, a lack of formal financial contracts between the state and the landowners caused social friction, as Tukuraki's modern amenities surpassed the host community's. As a result, Fiji now mandates 90% community consent. Currently, six villages have moved, and nearly 50 Fijian villages face potential relocation.
Relocation is expensive. Moving Fiji’s Nabavatu village required an investment of NZ$4.6 million (or $5.9 million USD). Weather and supply delays stalled the construction of permanent housing for 37 families living in temporary disaster tents for nearly six years. To fund relocations, Fiji enacted the world's first Climate Relocation of Communities (CROC) Trust Fund Act in 2019, financed via a 3% tourism and luxury goods levy. Regionally, the Pacific-owned, grant-based Pacific Resilience Facility (PRF) helps bypass slow and bureaucratic hurdles of global financial institutions.
Climate adaptation solutions pay dividends
Benefits include avoided losses, economic, social, and environmental gains. Each 💵 represents US$1 USD; half a banknote represents 50 cents.
Source: World Resources Institute
Investing in climate adaptation solutions yields high return. The World Resources Institute (WRI) estimates that every $1 USD spent returns $10.50 USD in net economic benefits over a 10-year horizon. This proactive model delivers continuous commercial, social, and environmental gains — such as local job creation, boosted agricultural productivity, and restored ecosystems — that far exceed avoided losses alone. The investment pays off even if a disaster never strikes.
