Data Visualization
I bring data to life with bespoke static, interactive, and scrollytelling visuals that invite people to step inside your story, help them see a piece of their own world in your data, and make complex information feel immersive and human.
I work primarily in R and its visualization libraries, along with Highcharter, Flourish, QGIS, HTML/CSS, and JavaScript libraries like Scrollama. Lately, I’ve been exploring the creative possibilities of D3.js and React.
Here’s a sample of my visuals.
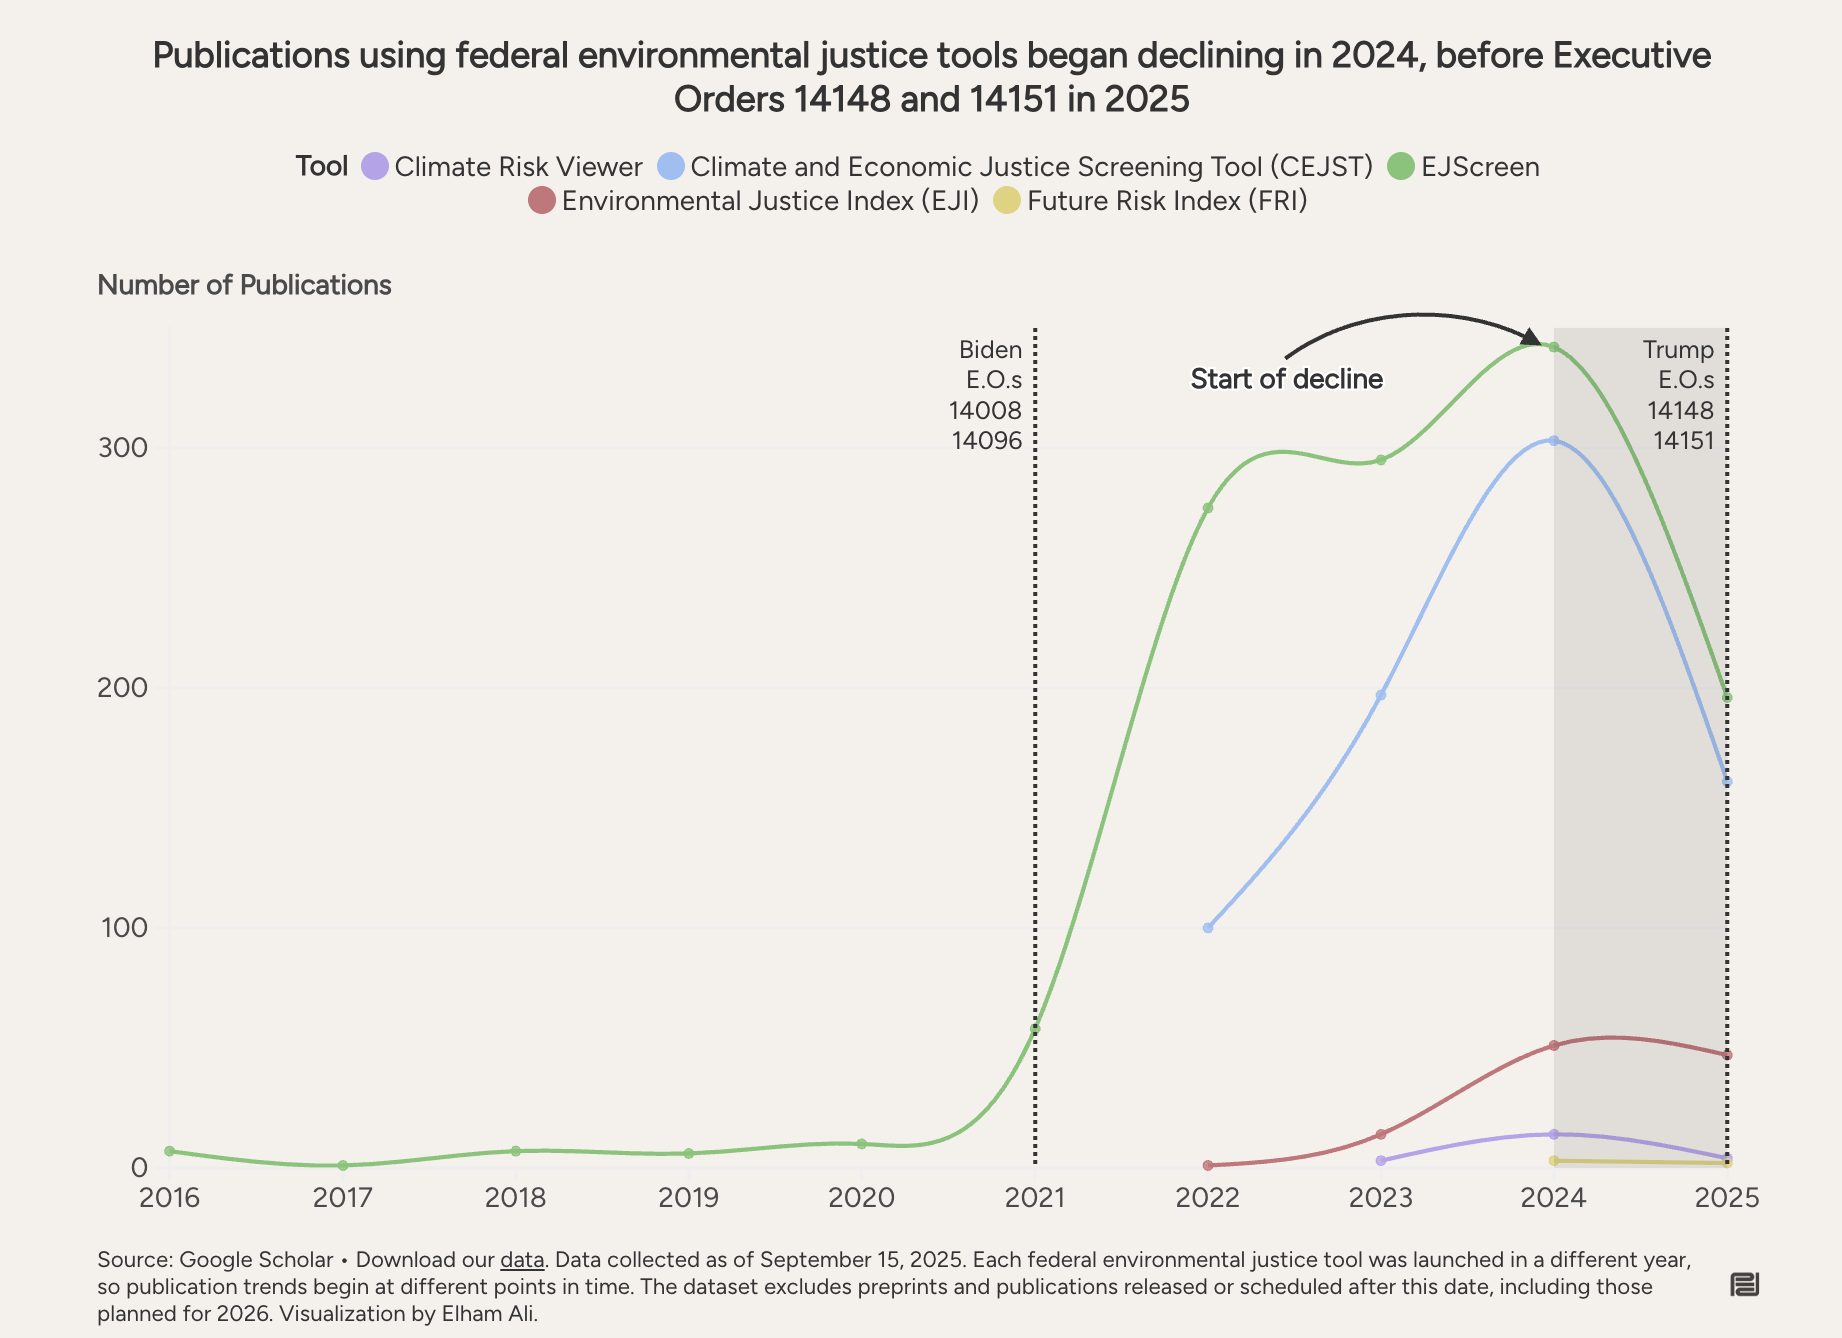
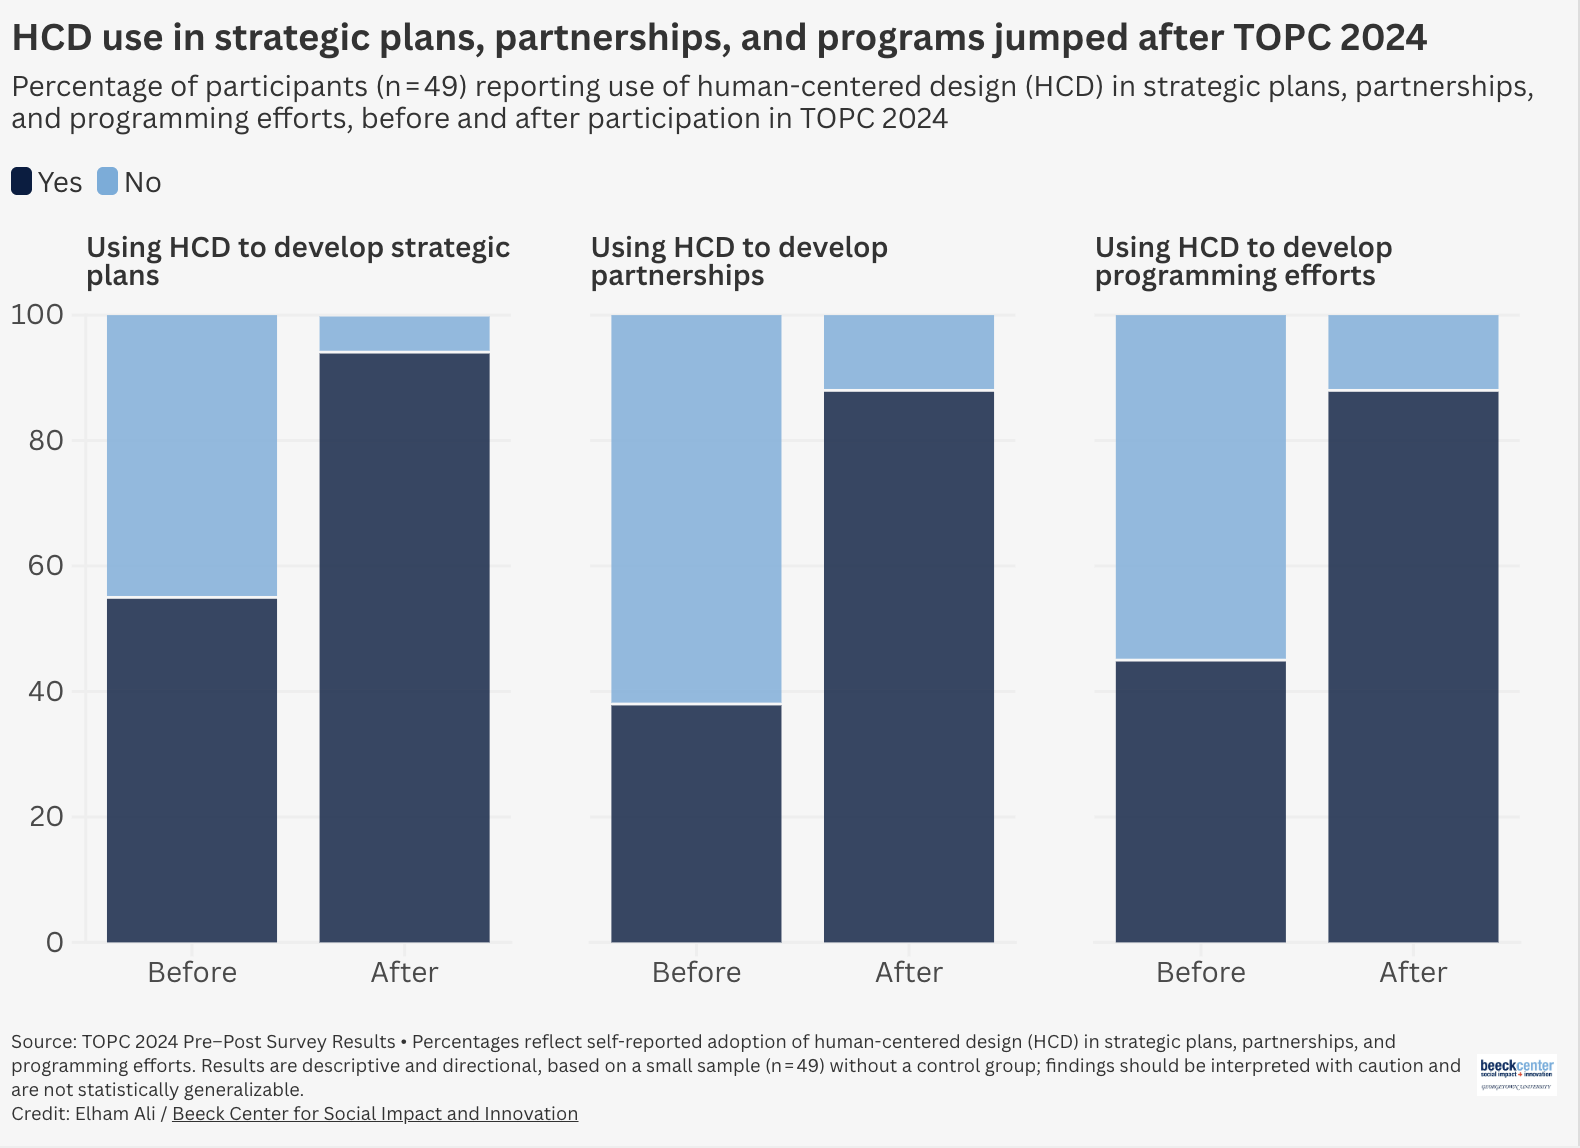
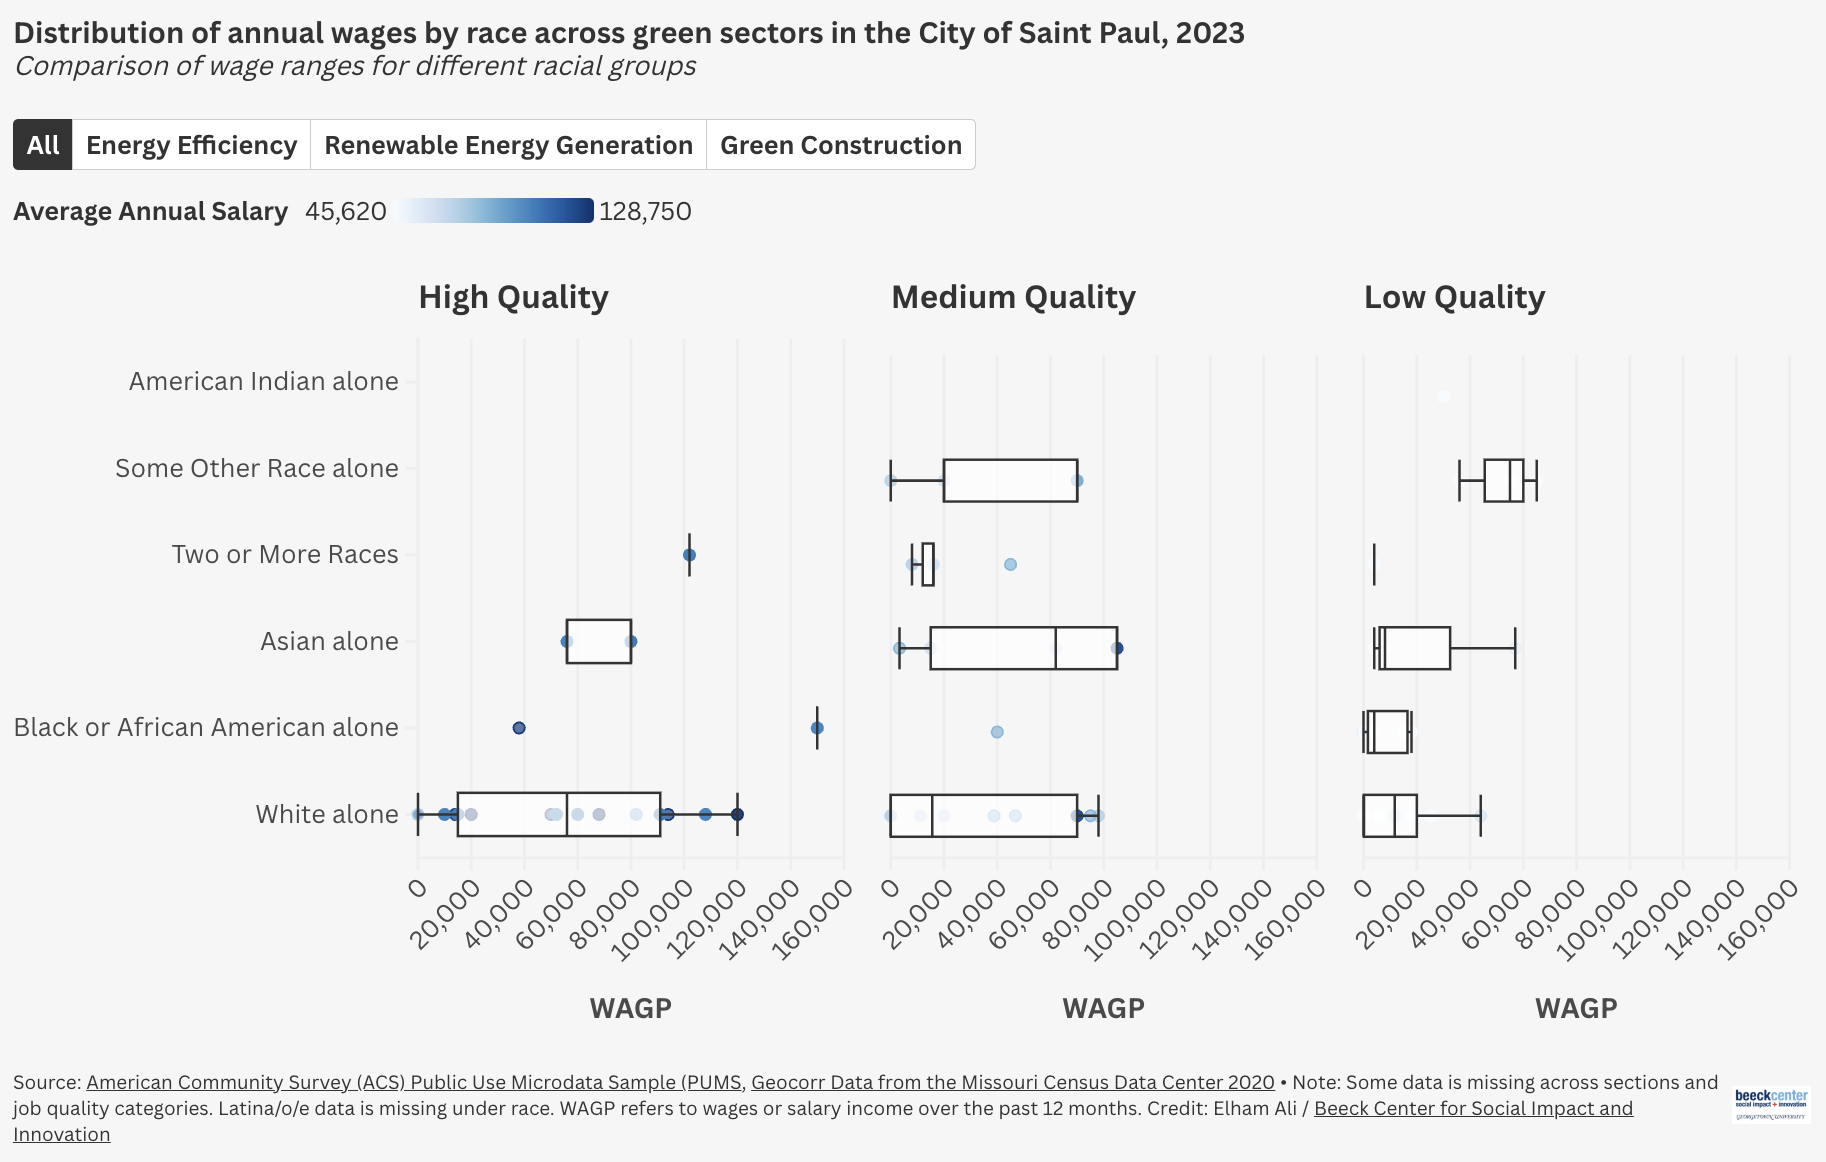
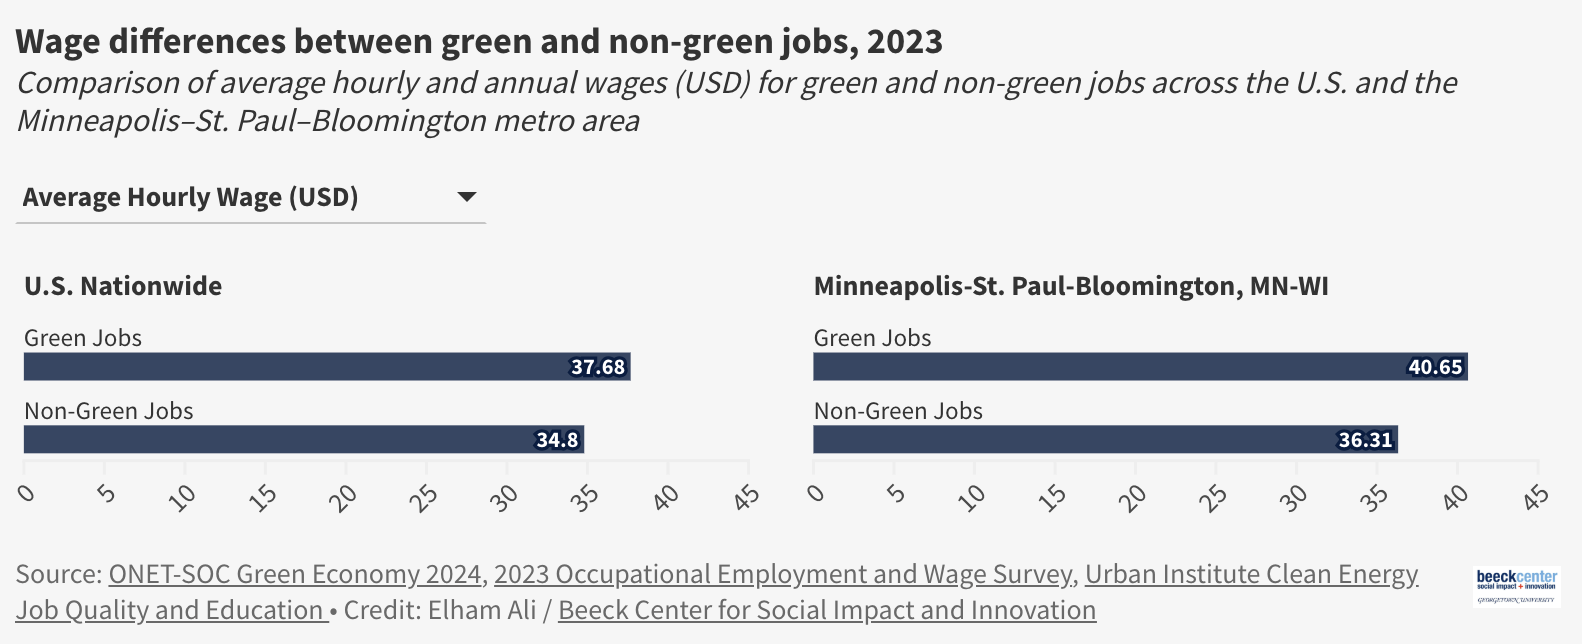
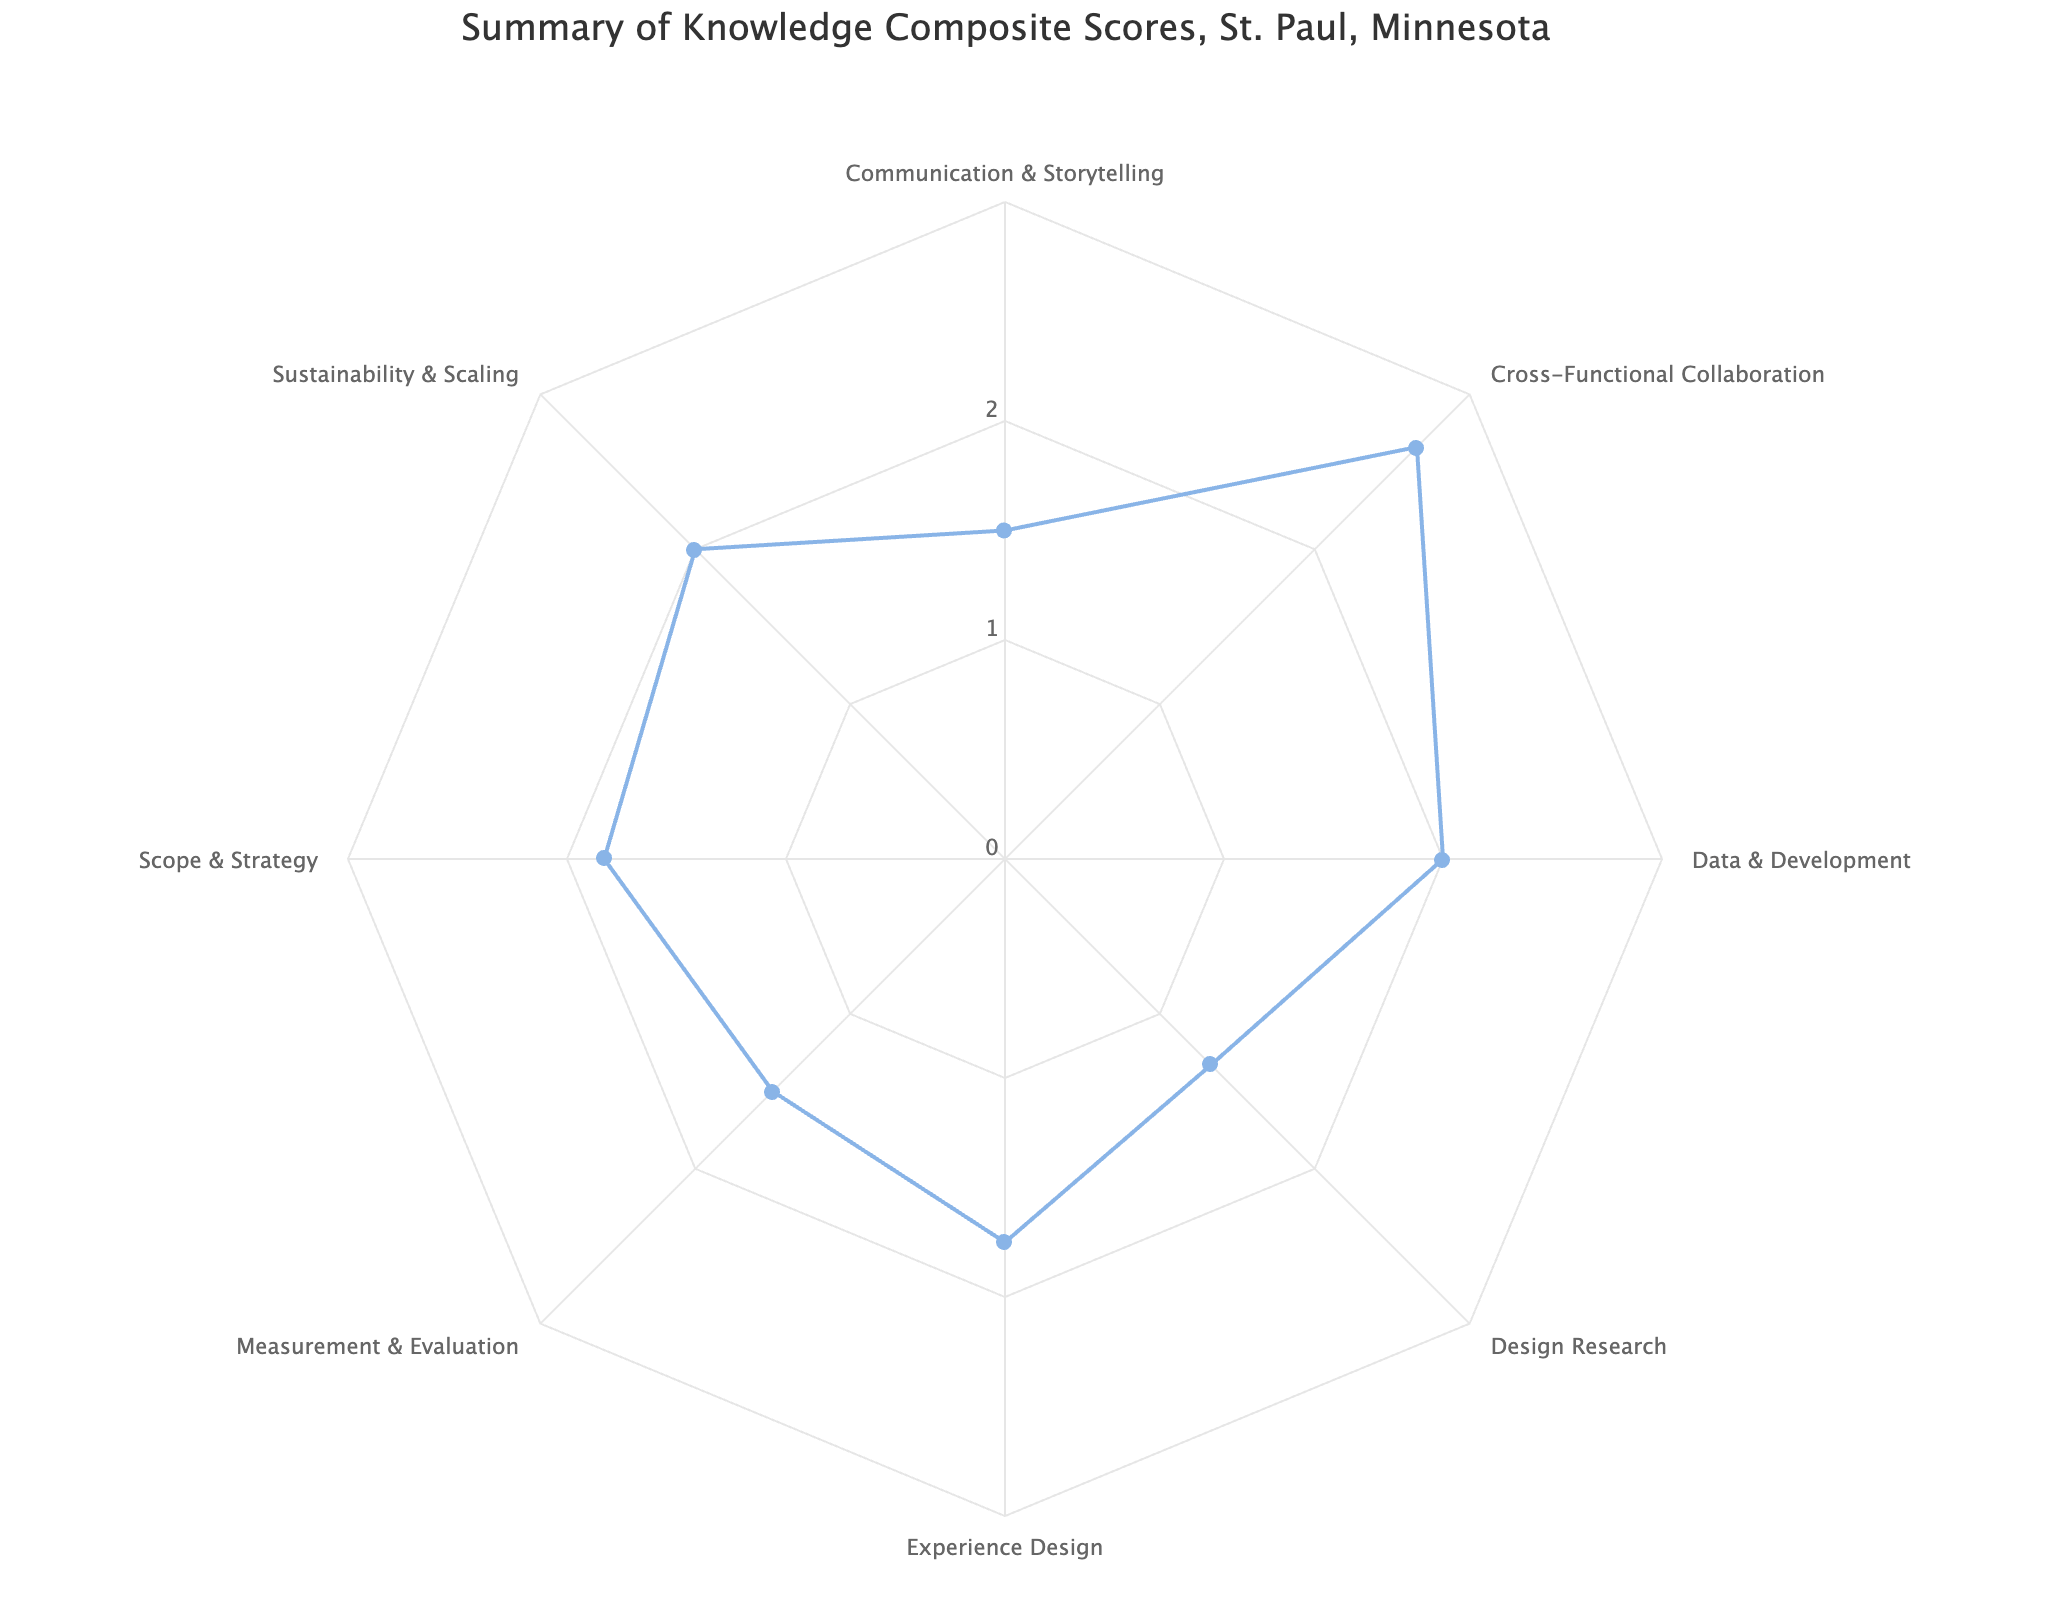
Static Visualizations
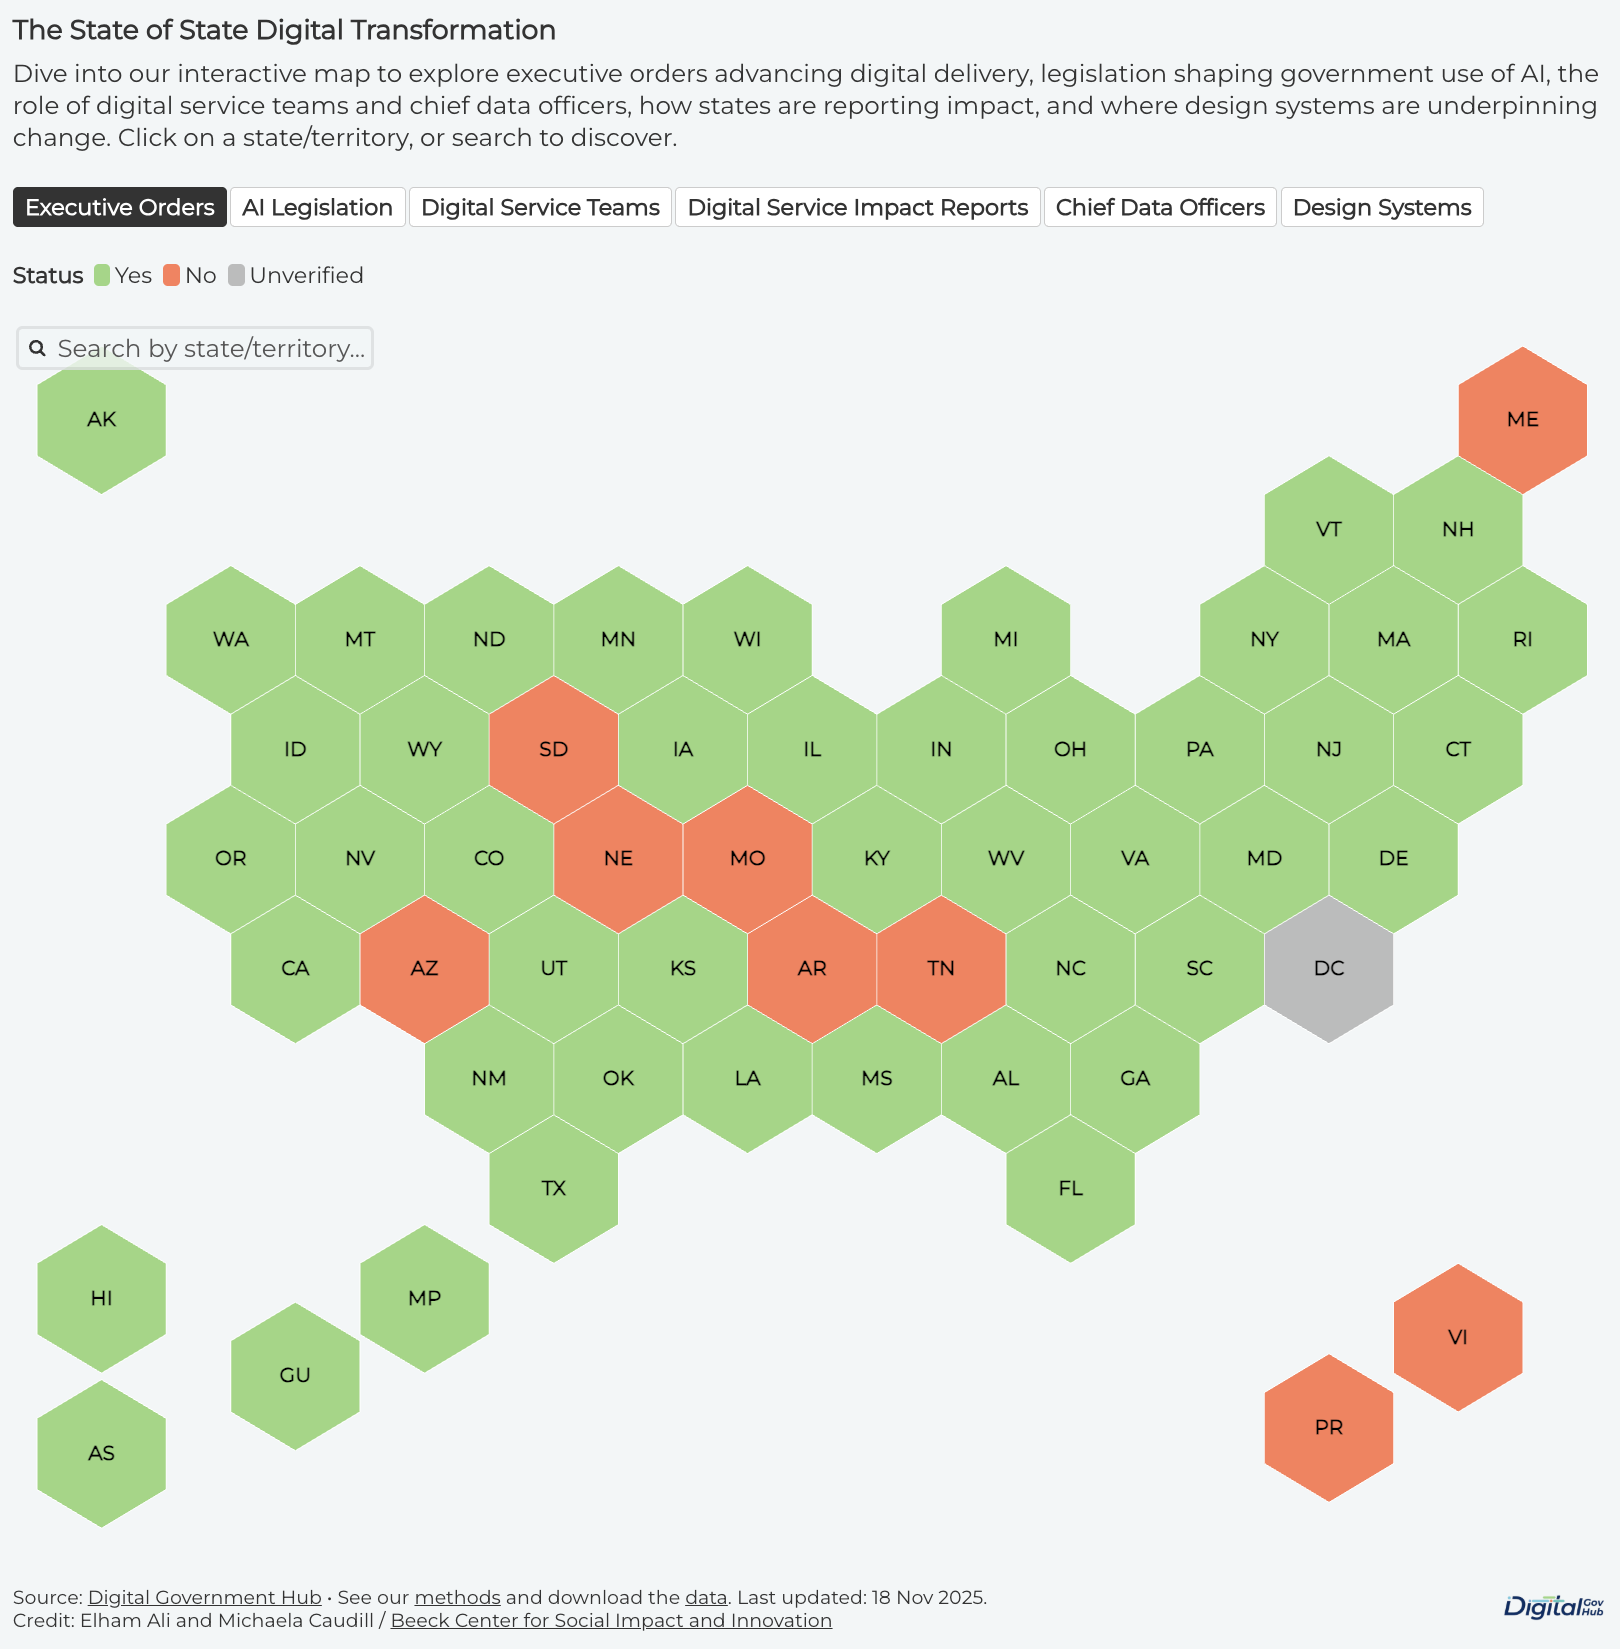
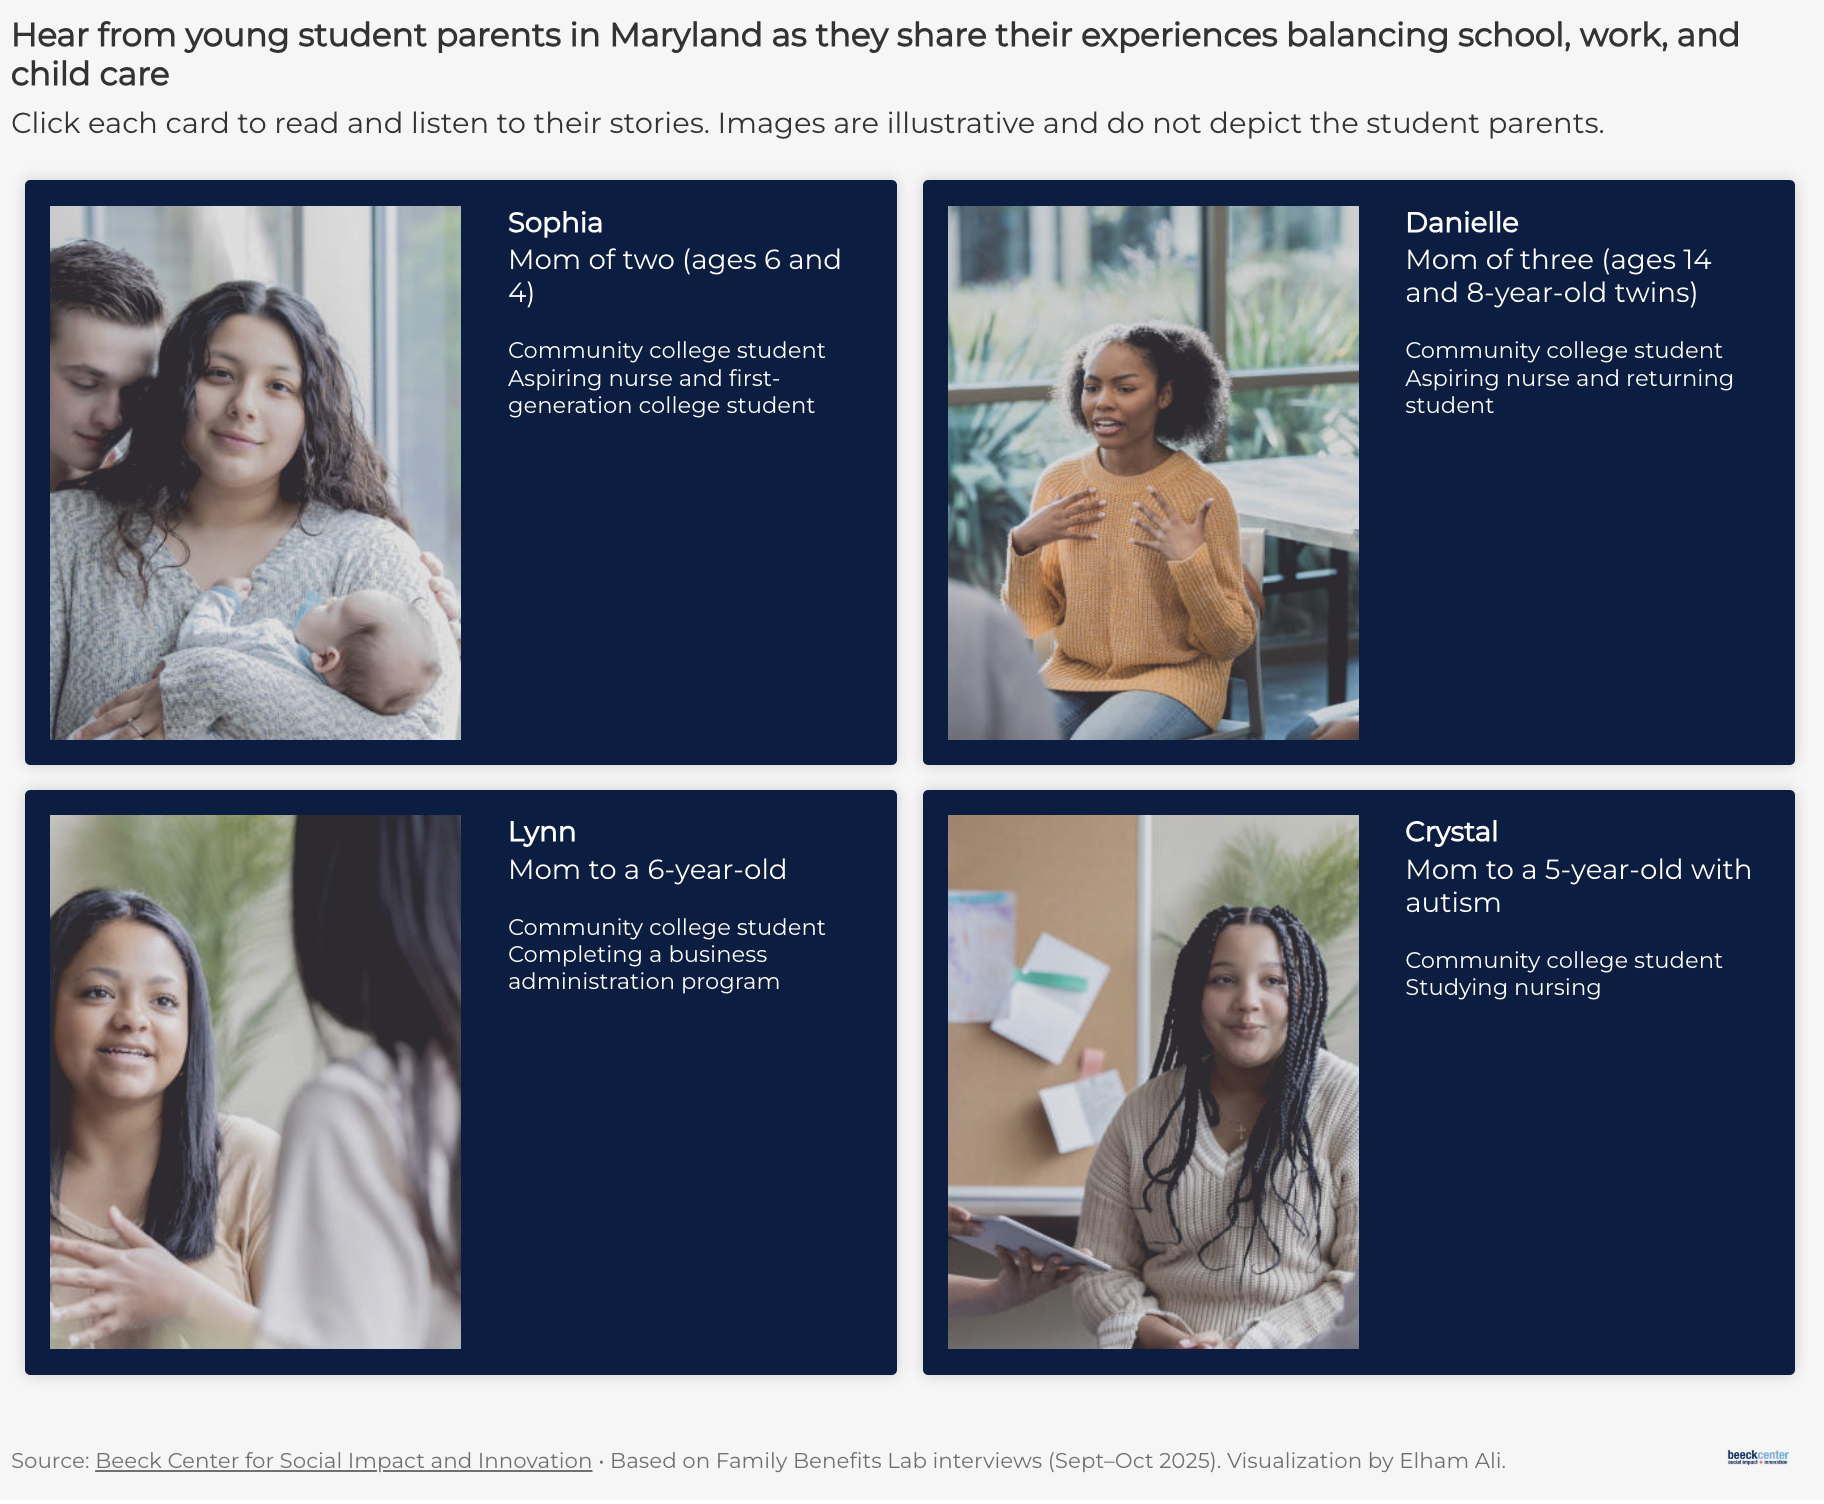
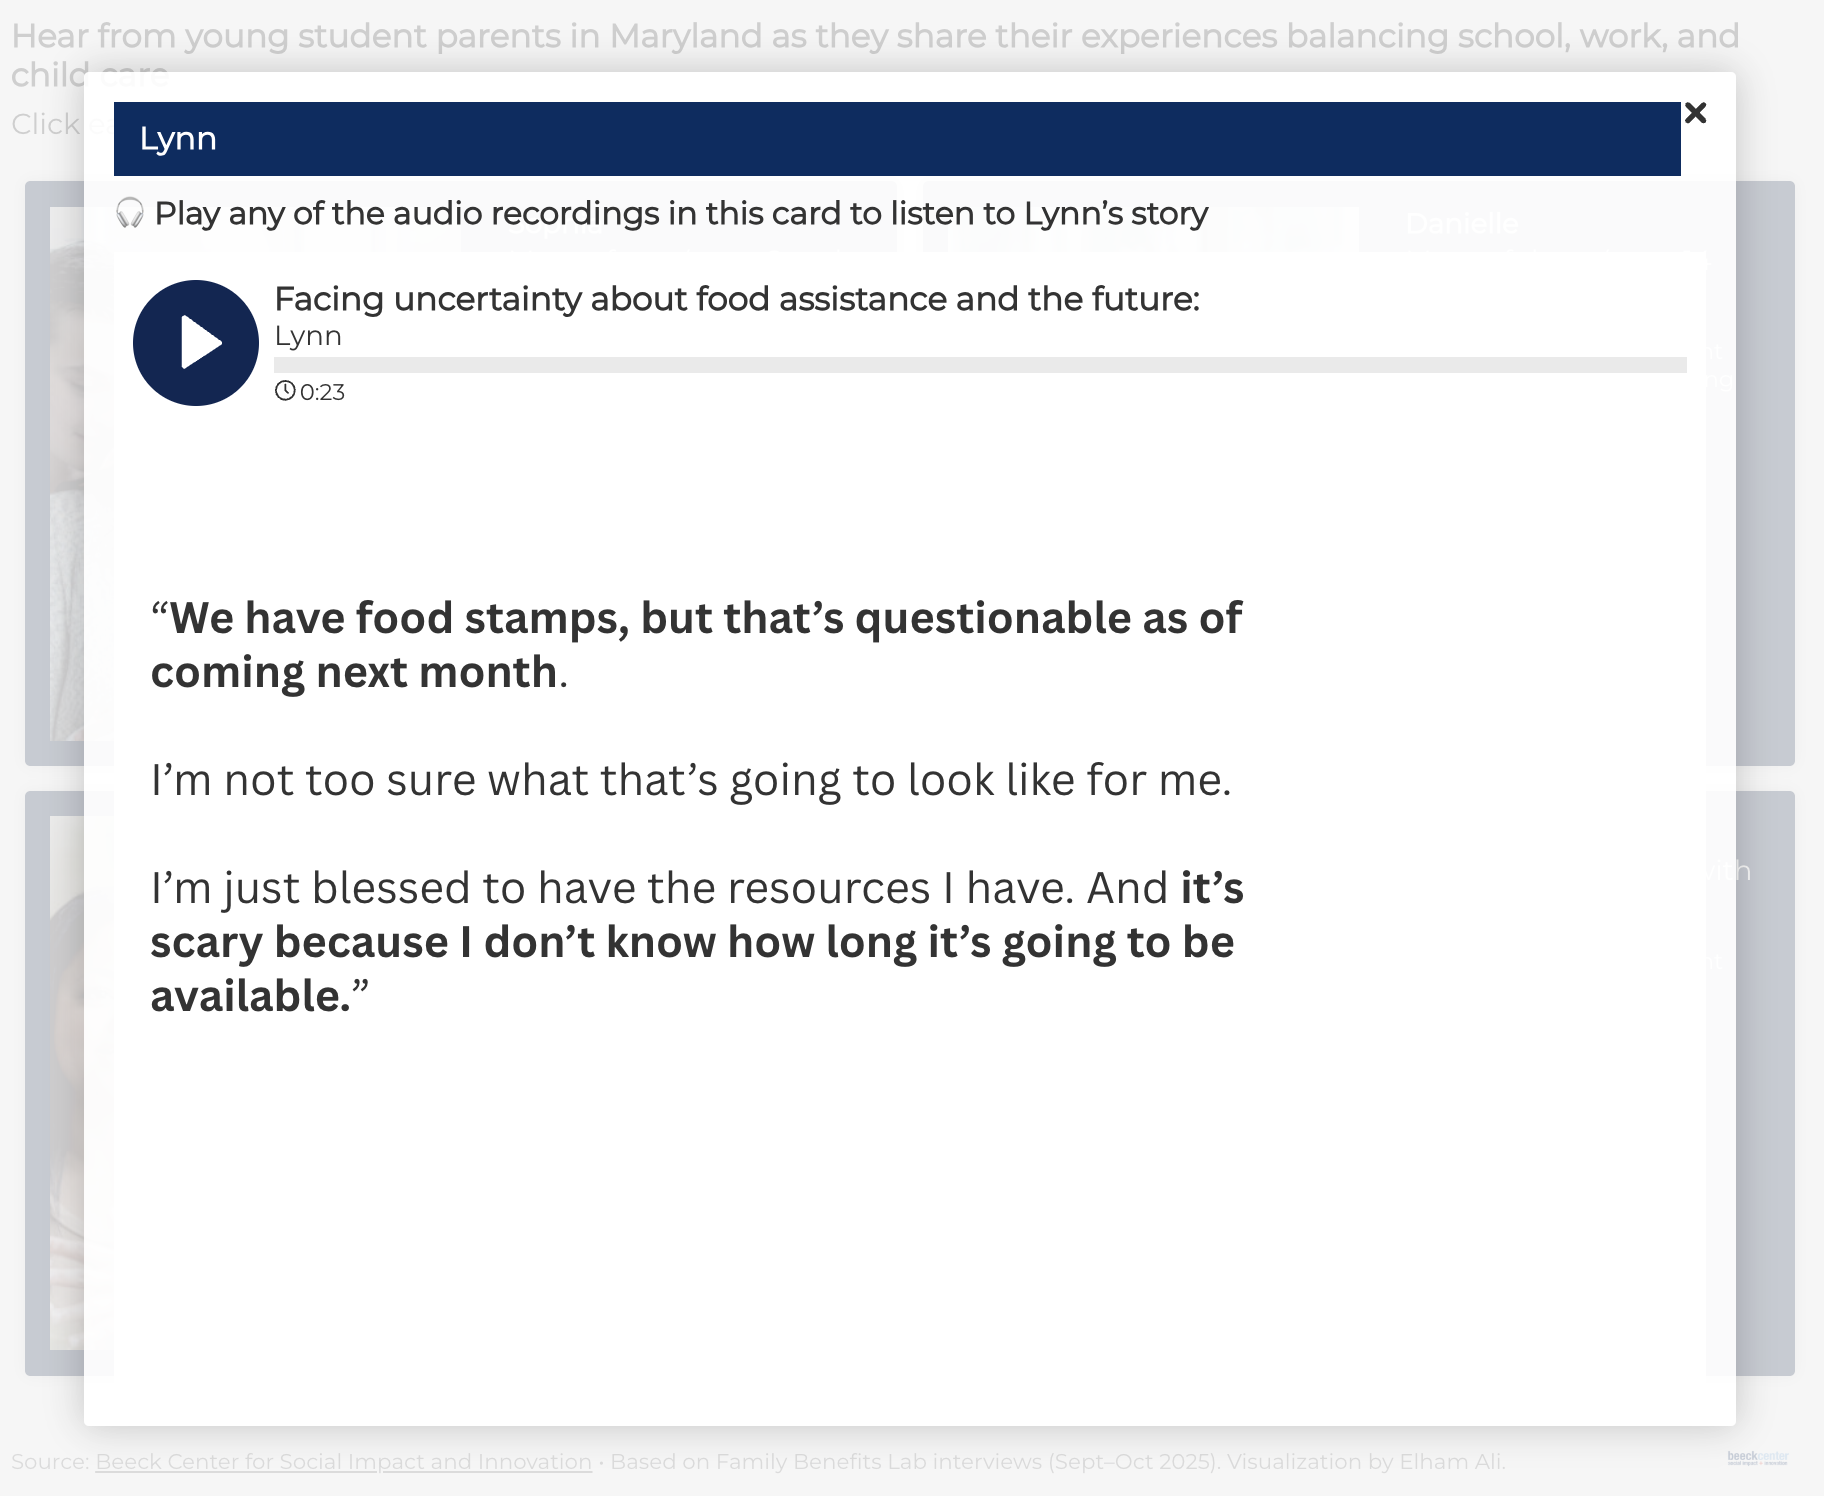
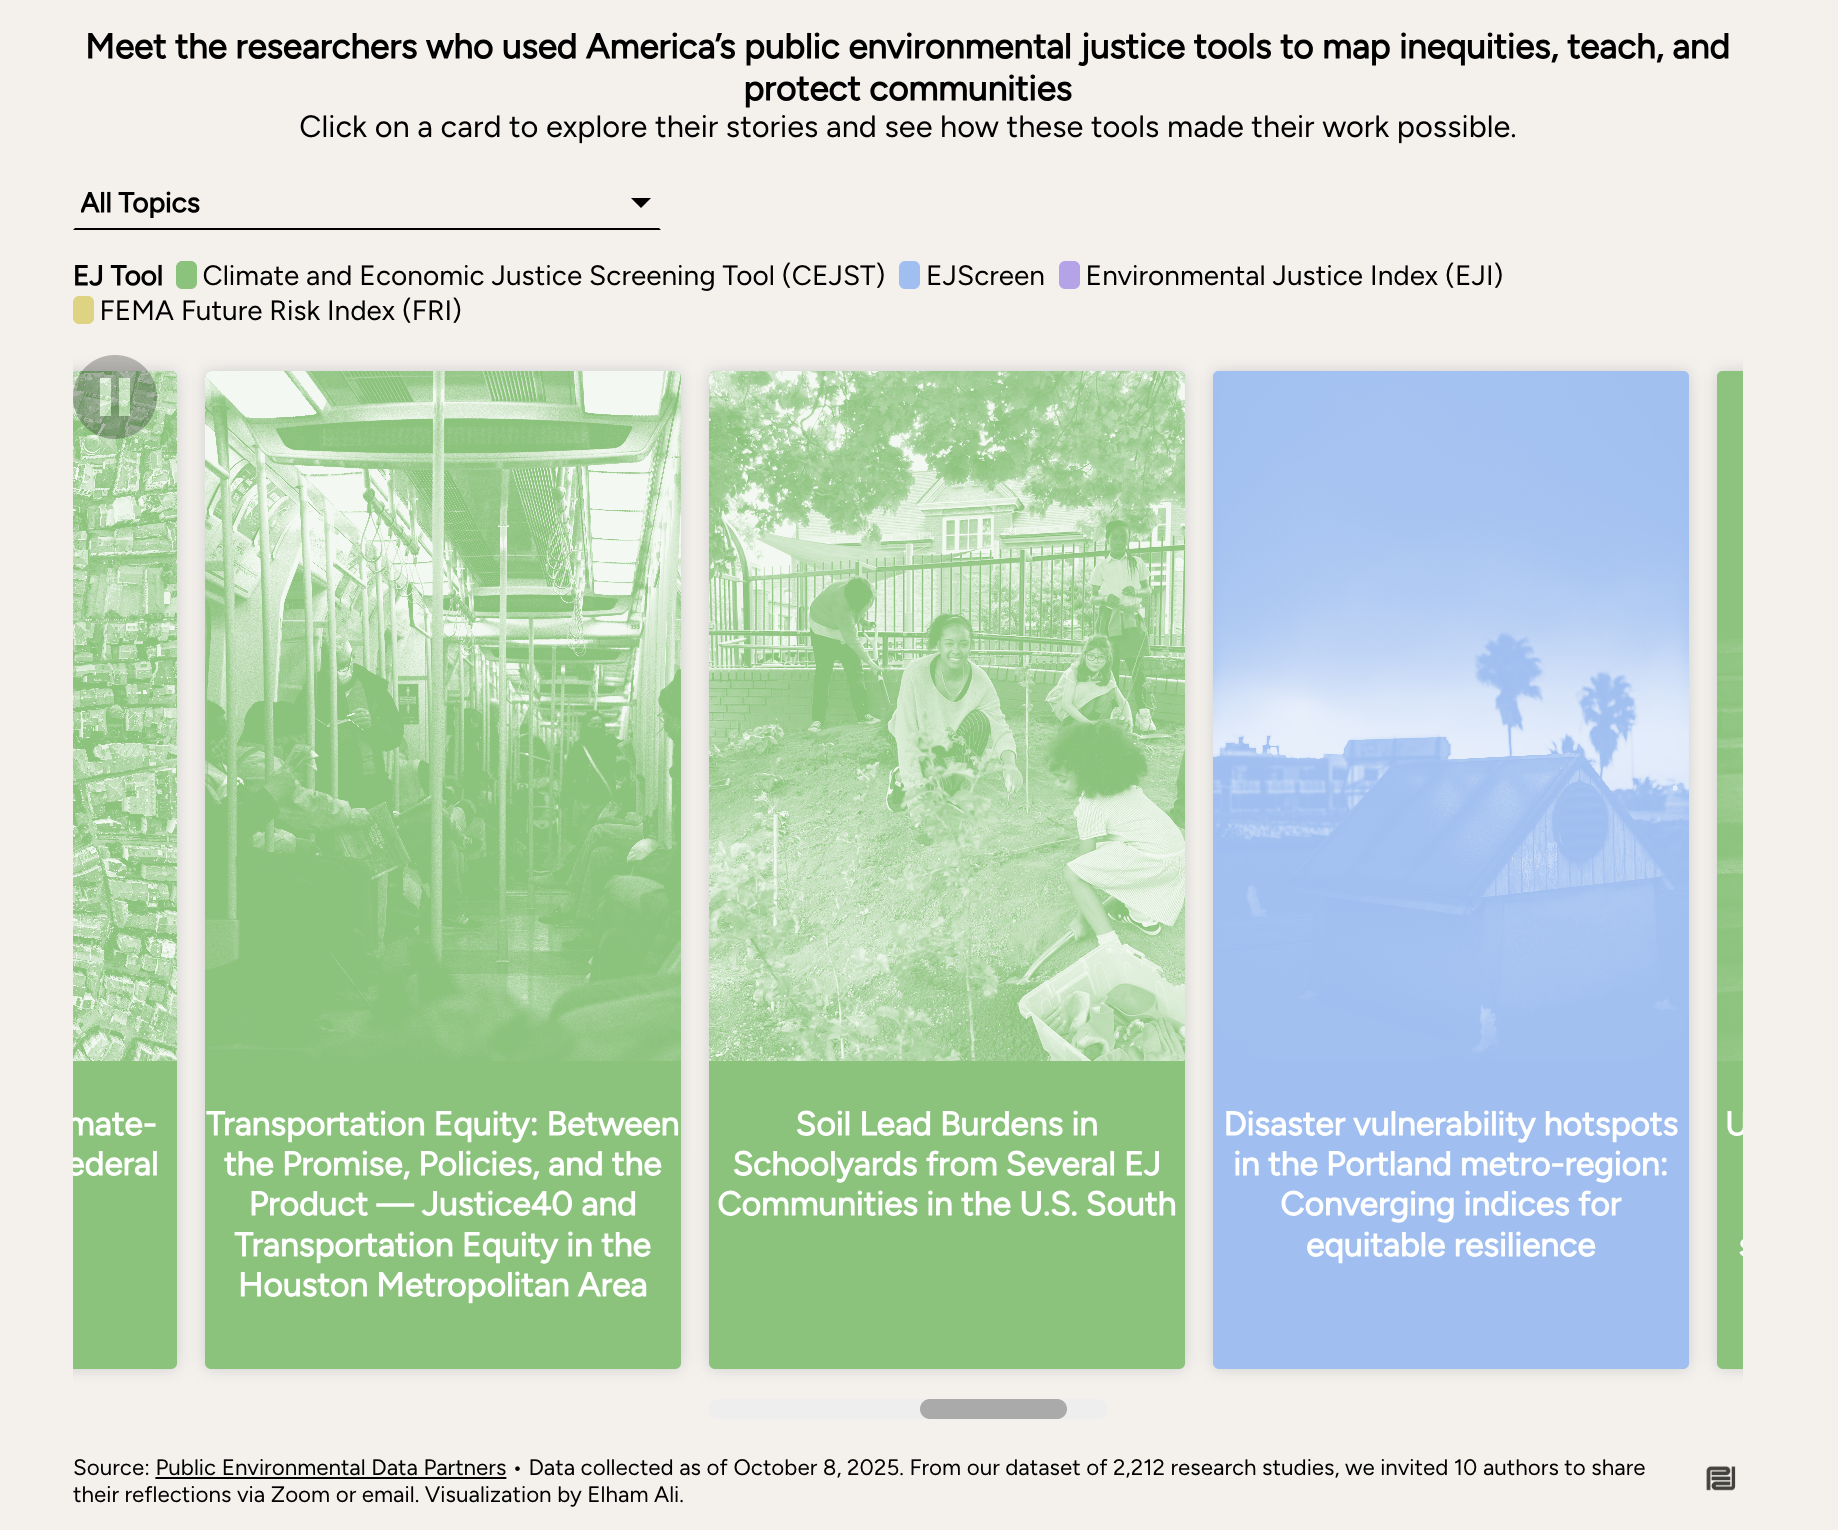
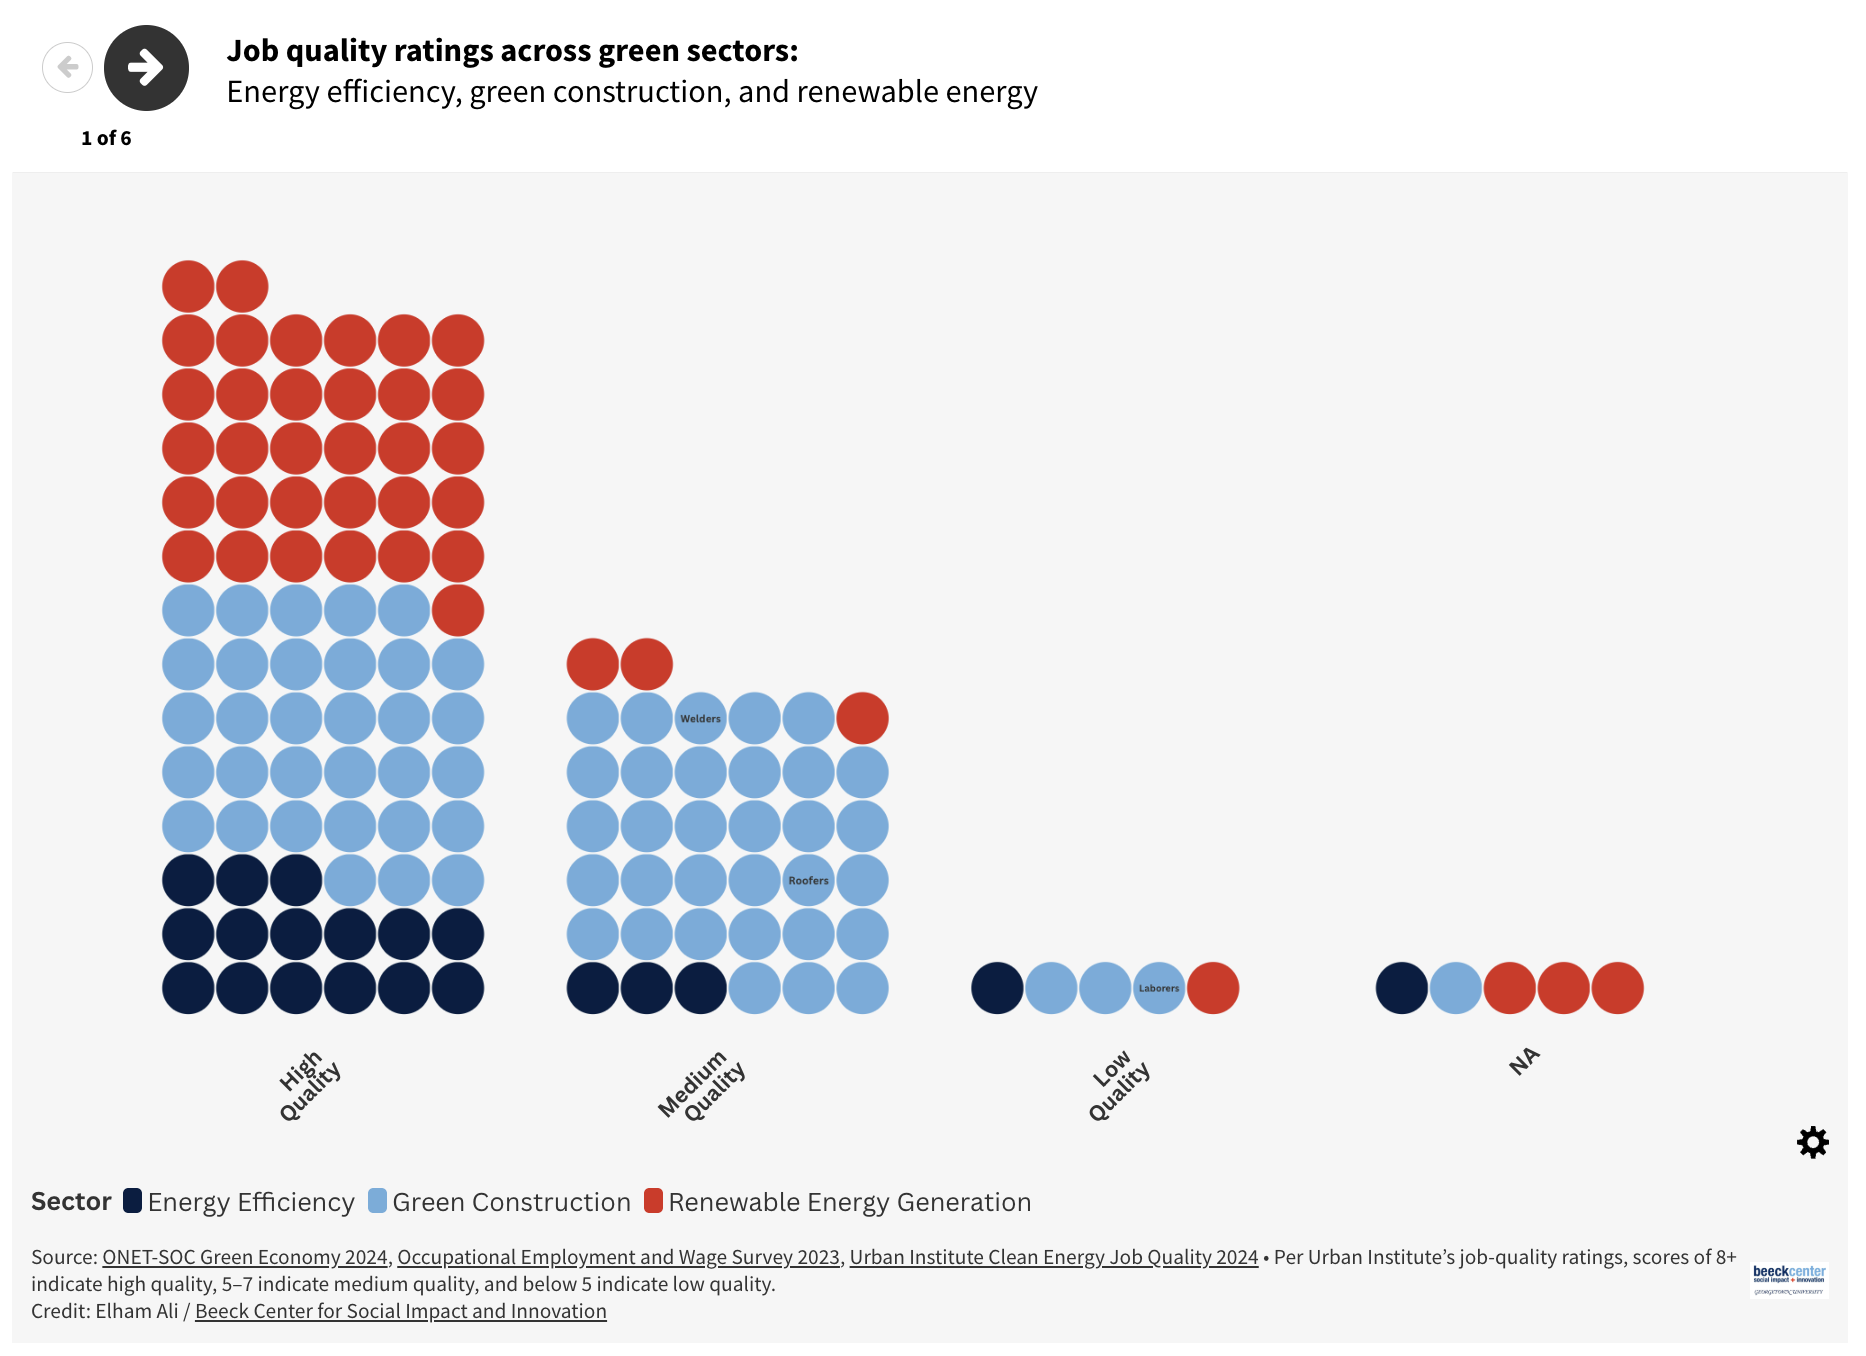
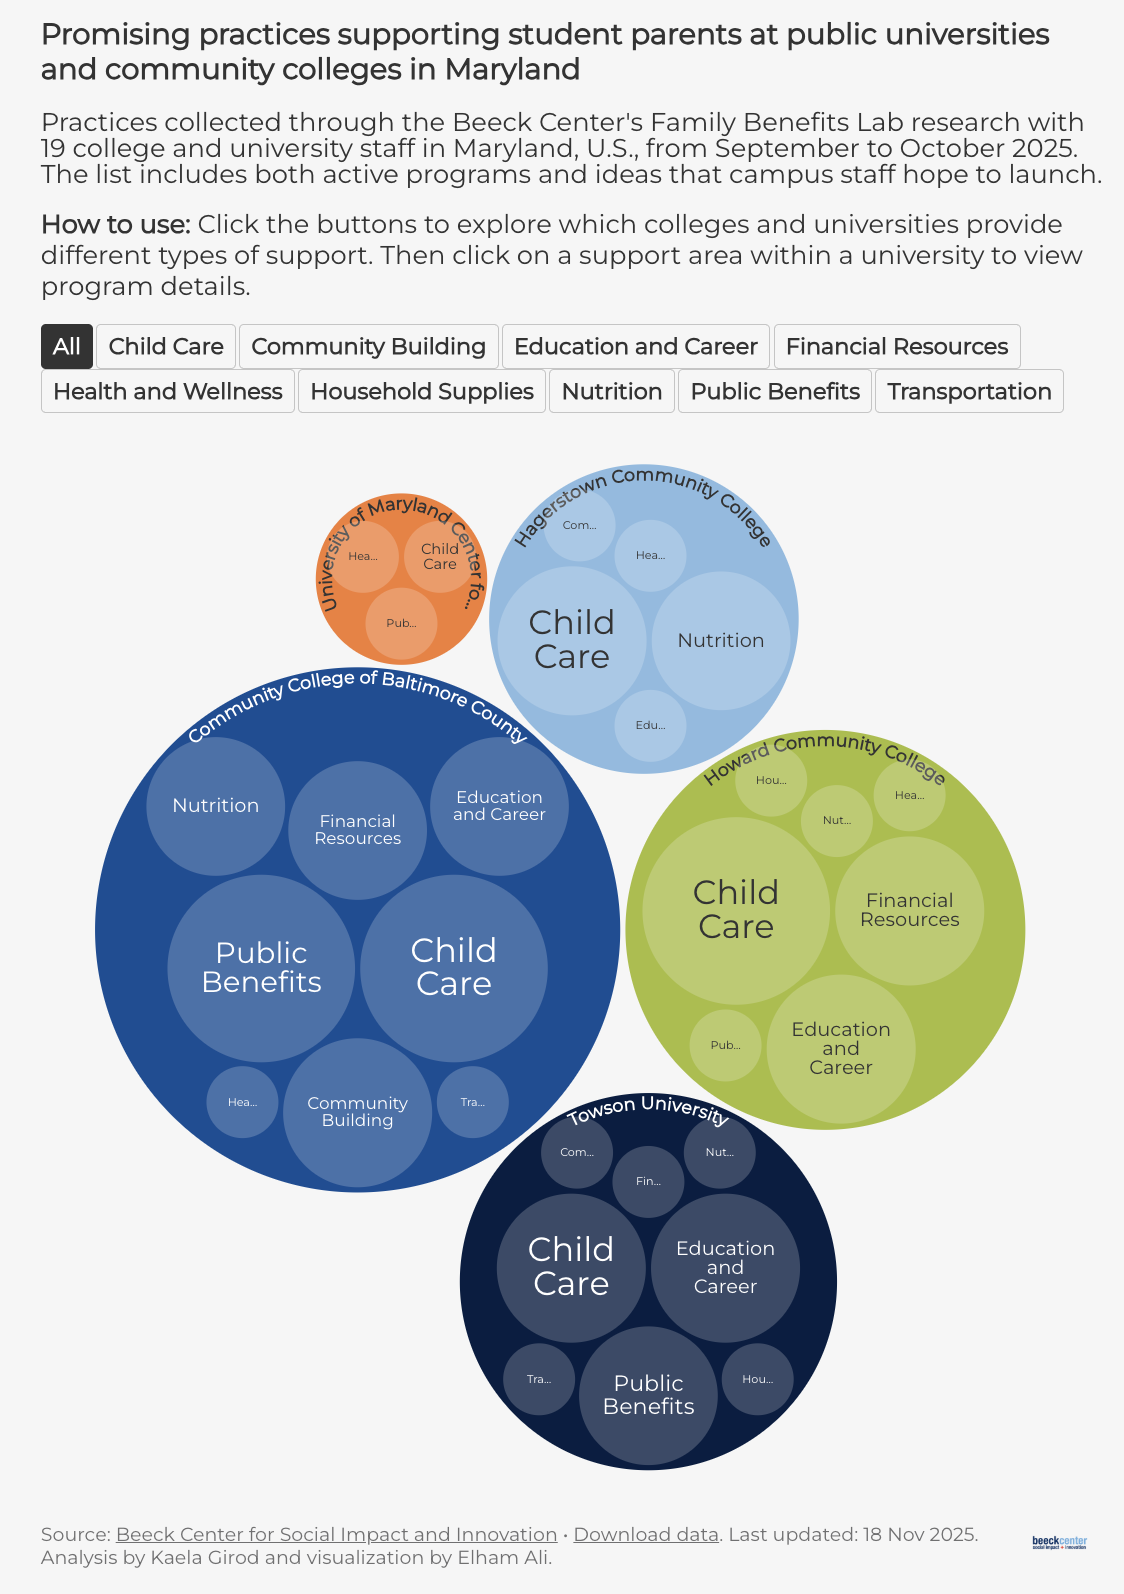
Interactive web-based
Animated/scrollytelling